


- XRP price has remained in a narrow range since February this year.
- The coin has formed a bearish pennant pattern on the daily timeframe chart.
- Ripple Labs has had some major milestones, including its valuation surge.
XRP price retreated to $1.4 on Monday as demand continued to wane and exchange-traded funds (ETF) outflows continued. Ripple has now dropped by over 61% from its highest point in 2025 despite its improving fundamentals. So, will it crash to $1 or hit $2 first?
XRP Price Drops as ETF Outflows Jump
Something new is happening in the XRP ETF market. For the first time since their approval in November, investors are continously selling their holdings.
Data shows that spot XRP ETFs have had over $31 million in outflows this month, a sign that investors are capitulating after the price remained in a narrow range in the past two months.
The funds have had over $1.5 billion in inflows since their inception and now hold $1.01 billion in assets, with the Canary, Bitwise, and Franklin having $282 million, $276 million, and $228 million, respectively.
In contrast, spot Bitcoin ETFs have added over $1.4 billion in inflows after shedding over $6 billion in the previous four consecutive months. Spot Ethereum ETFs have also added $138 million, while Solana funds have had $55 million in inflows. Solana funds have never had a monthly outflow.
READ MORE: PayPal Stock On The Verge of a Crash Despite Robust PYUSD Growth
XRP has had some good news in the past few weeks. For example, Ripple Labs reached a valuation of $50 billion this year, a few months after it had reached $40 billion in a fundraising led by Citadel and Fortress.
More on-chain data shows that the number of transactions has jumped to over 1 million a day, while the number of active transacting users has increased to 225k. This is happening as more people are embracing its platform.
Most importantly, Ripple USD (RLUSD) is doing well, with its supply soaring to over $1.5 billion. RLUSD handled over $5.5 billion, while its stablecoin supply jumped to 692k. Also, the number of addresses went parabolic, rising from 6k to over 13k earlier this month.
Ripple Price Prediction: Technical Analysis
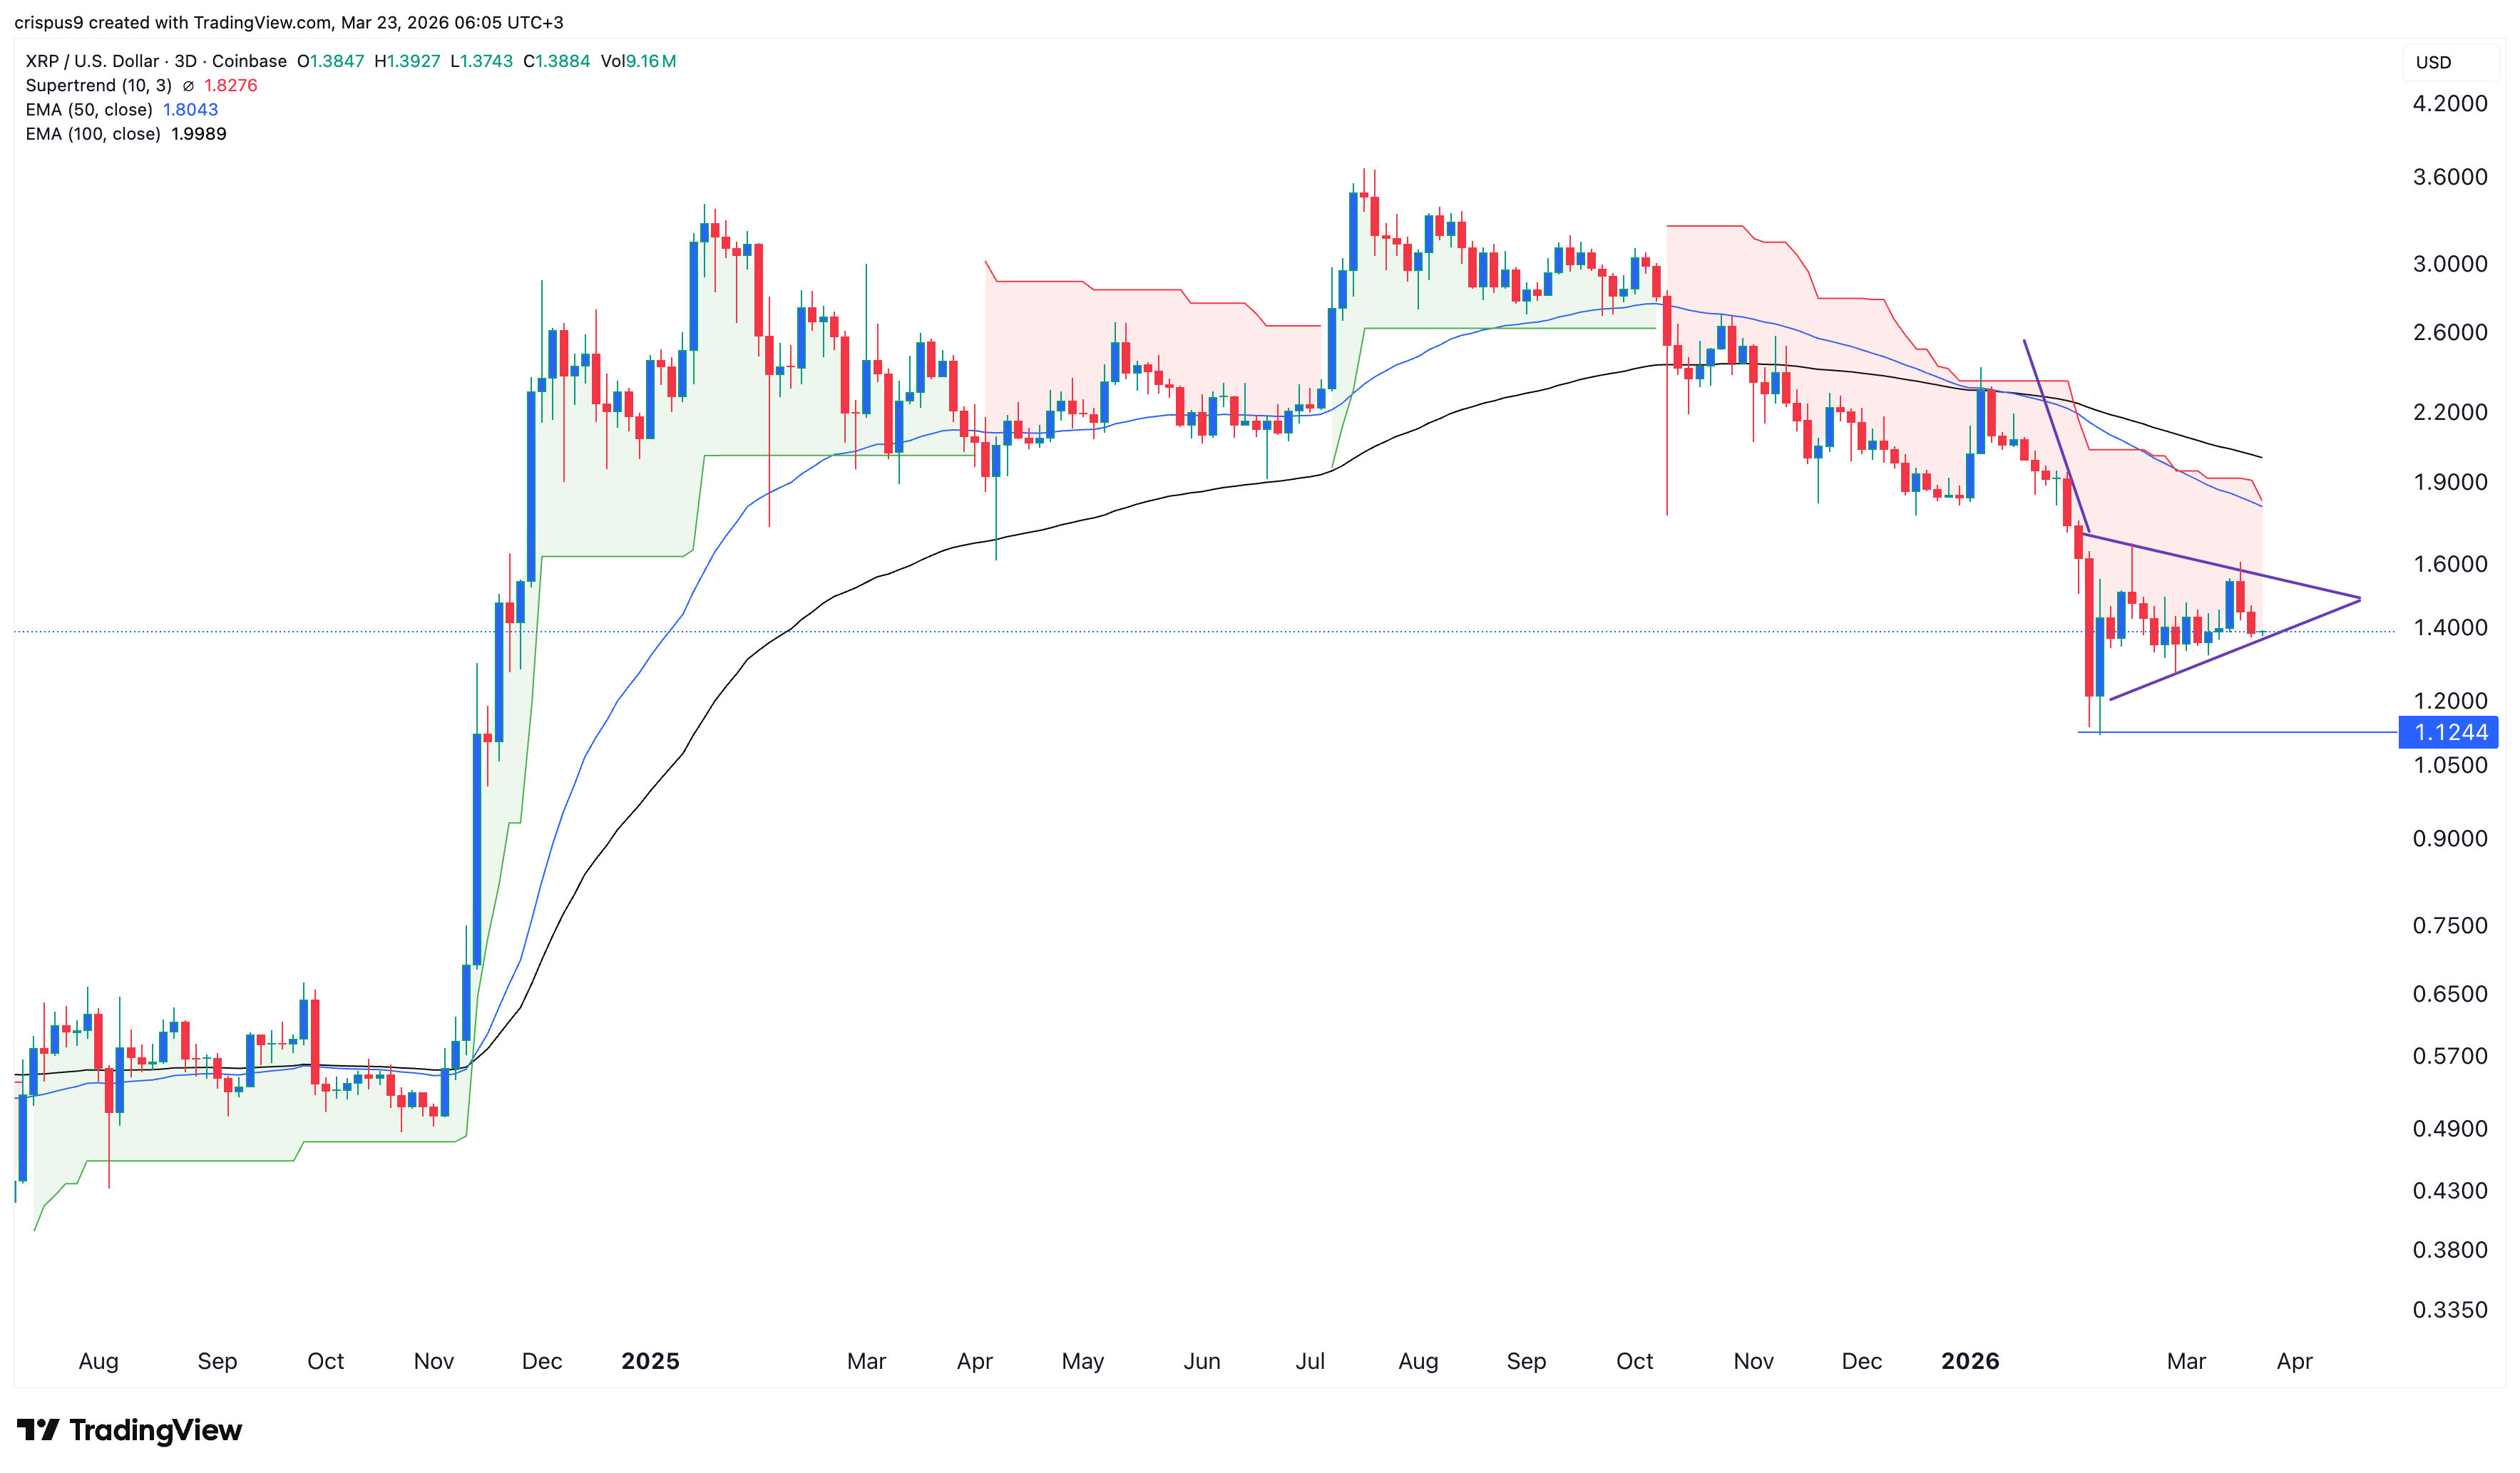
XRP price chart | Source: TradingView
The three-day chart shows that the XRP price has held steady in the past two months. It has remained below the 50-day and 100-day Exponential Moving Averages (EMA). Also, the Supertrend indicator has remained in the red in this period.
Most importantly, the token has formed a symmetrical triangle pattern, with its two lines nearing confluence. This triangle is part of the bearish pennant pattern, a common bearish continuation sign in technical analysis.
Therefore, the most likely XRP price prediction is bearish, with the next key target being at the year-to-date low of $1.1245. A move below that level will point to more downside to $1. Chances of the token rising to the key resistance level at $2 are a bit limited, but will only happen if it moves above the upper side of the triangle.
READ MORE: Cardano Unveils Blue Chip Partners as Midnight Mainnet Launch Nears