


Chainlink price shed 3.06% to $9.088 on Thursday, pulled down by a broad market retreat that cut the total crypto market cap 1.61% to $2.4 trillion. Bitcoin price dropped 1.7%, and spot BTC ETFs recorded $74.53 million in net outflows on March 25, profit-taking ahead of Friday’s U.S. PCE inflation data.
For the Chainlink coin, that risk-off backdrop proved heavier than a significant ecosystem partnership announced in the same session.
As previously reported, Coinbase integrated Chainlink’s DataLink service on March 25, formally connecting the largest U.S. crypto exchange with 85 million verified users, $254 billion in assets under custody, and $424 billion in total on-platform, to a network already securing over 59% of DeFi and supporting 2,206+ ecosystem projects.
With total transaction value enabled, Chainlink’s oracle infrastructure exceeds $24 trillion in value. The announcement carried real weight, but the market didn’t buy it.
Moreover, Chainlink is trading in the red despite Santiment data showing that wallets holding at least 1,000 Chainlink tokens reached 25,420, the highest count since December 3, 2025. Larger capital has been gradually re-entering since early February, while the Chainlink coin price has stayed range-bound between $9 and $10.
On the ETF front, Grayscale’s GLNK and Bitwise’s CLNK have accumulated $97.91 million in cumulative net inflows, with not a single day of net outflows, a consistency that stands in contrast to XRP ETF flows over the same window.
All Moving Averages Flash Sell as Chainlink Price Holds $9 Support
The weekly chart is unambiguous. Every applicable moving average, from the EMA(10) at $9.663 through the SMA(200) at $12.412, sits above the current LINK price and registers as a sell signal. The summary gauge on TradingView reads 14 sells, 10 neutral, 2 buys.
Moving averages alone clock in at Strong Sell, 13-to-1. Weekly RSI(14) at 46.01 and Momentum(10) both nudge neutral-to-buy, but neither carries enough weight to offset 13 overhead MAs pointing the same direction.
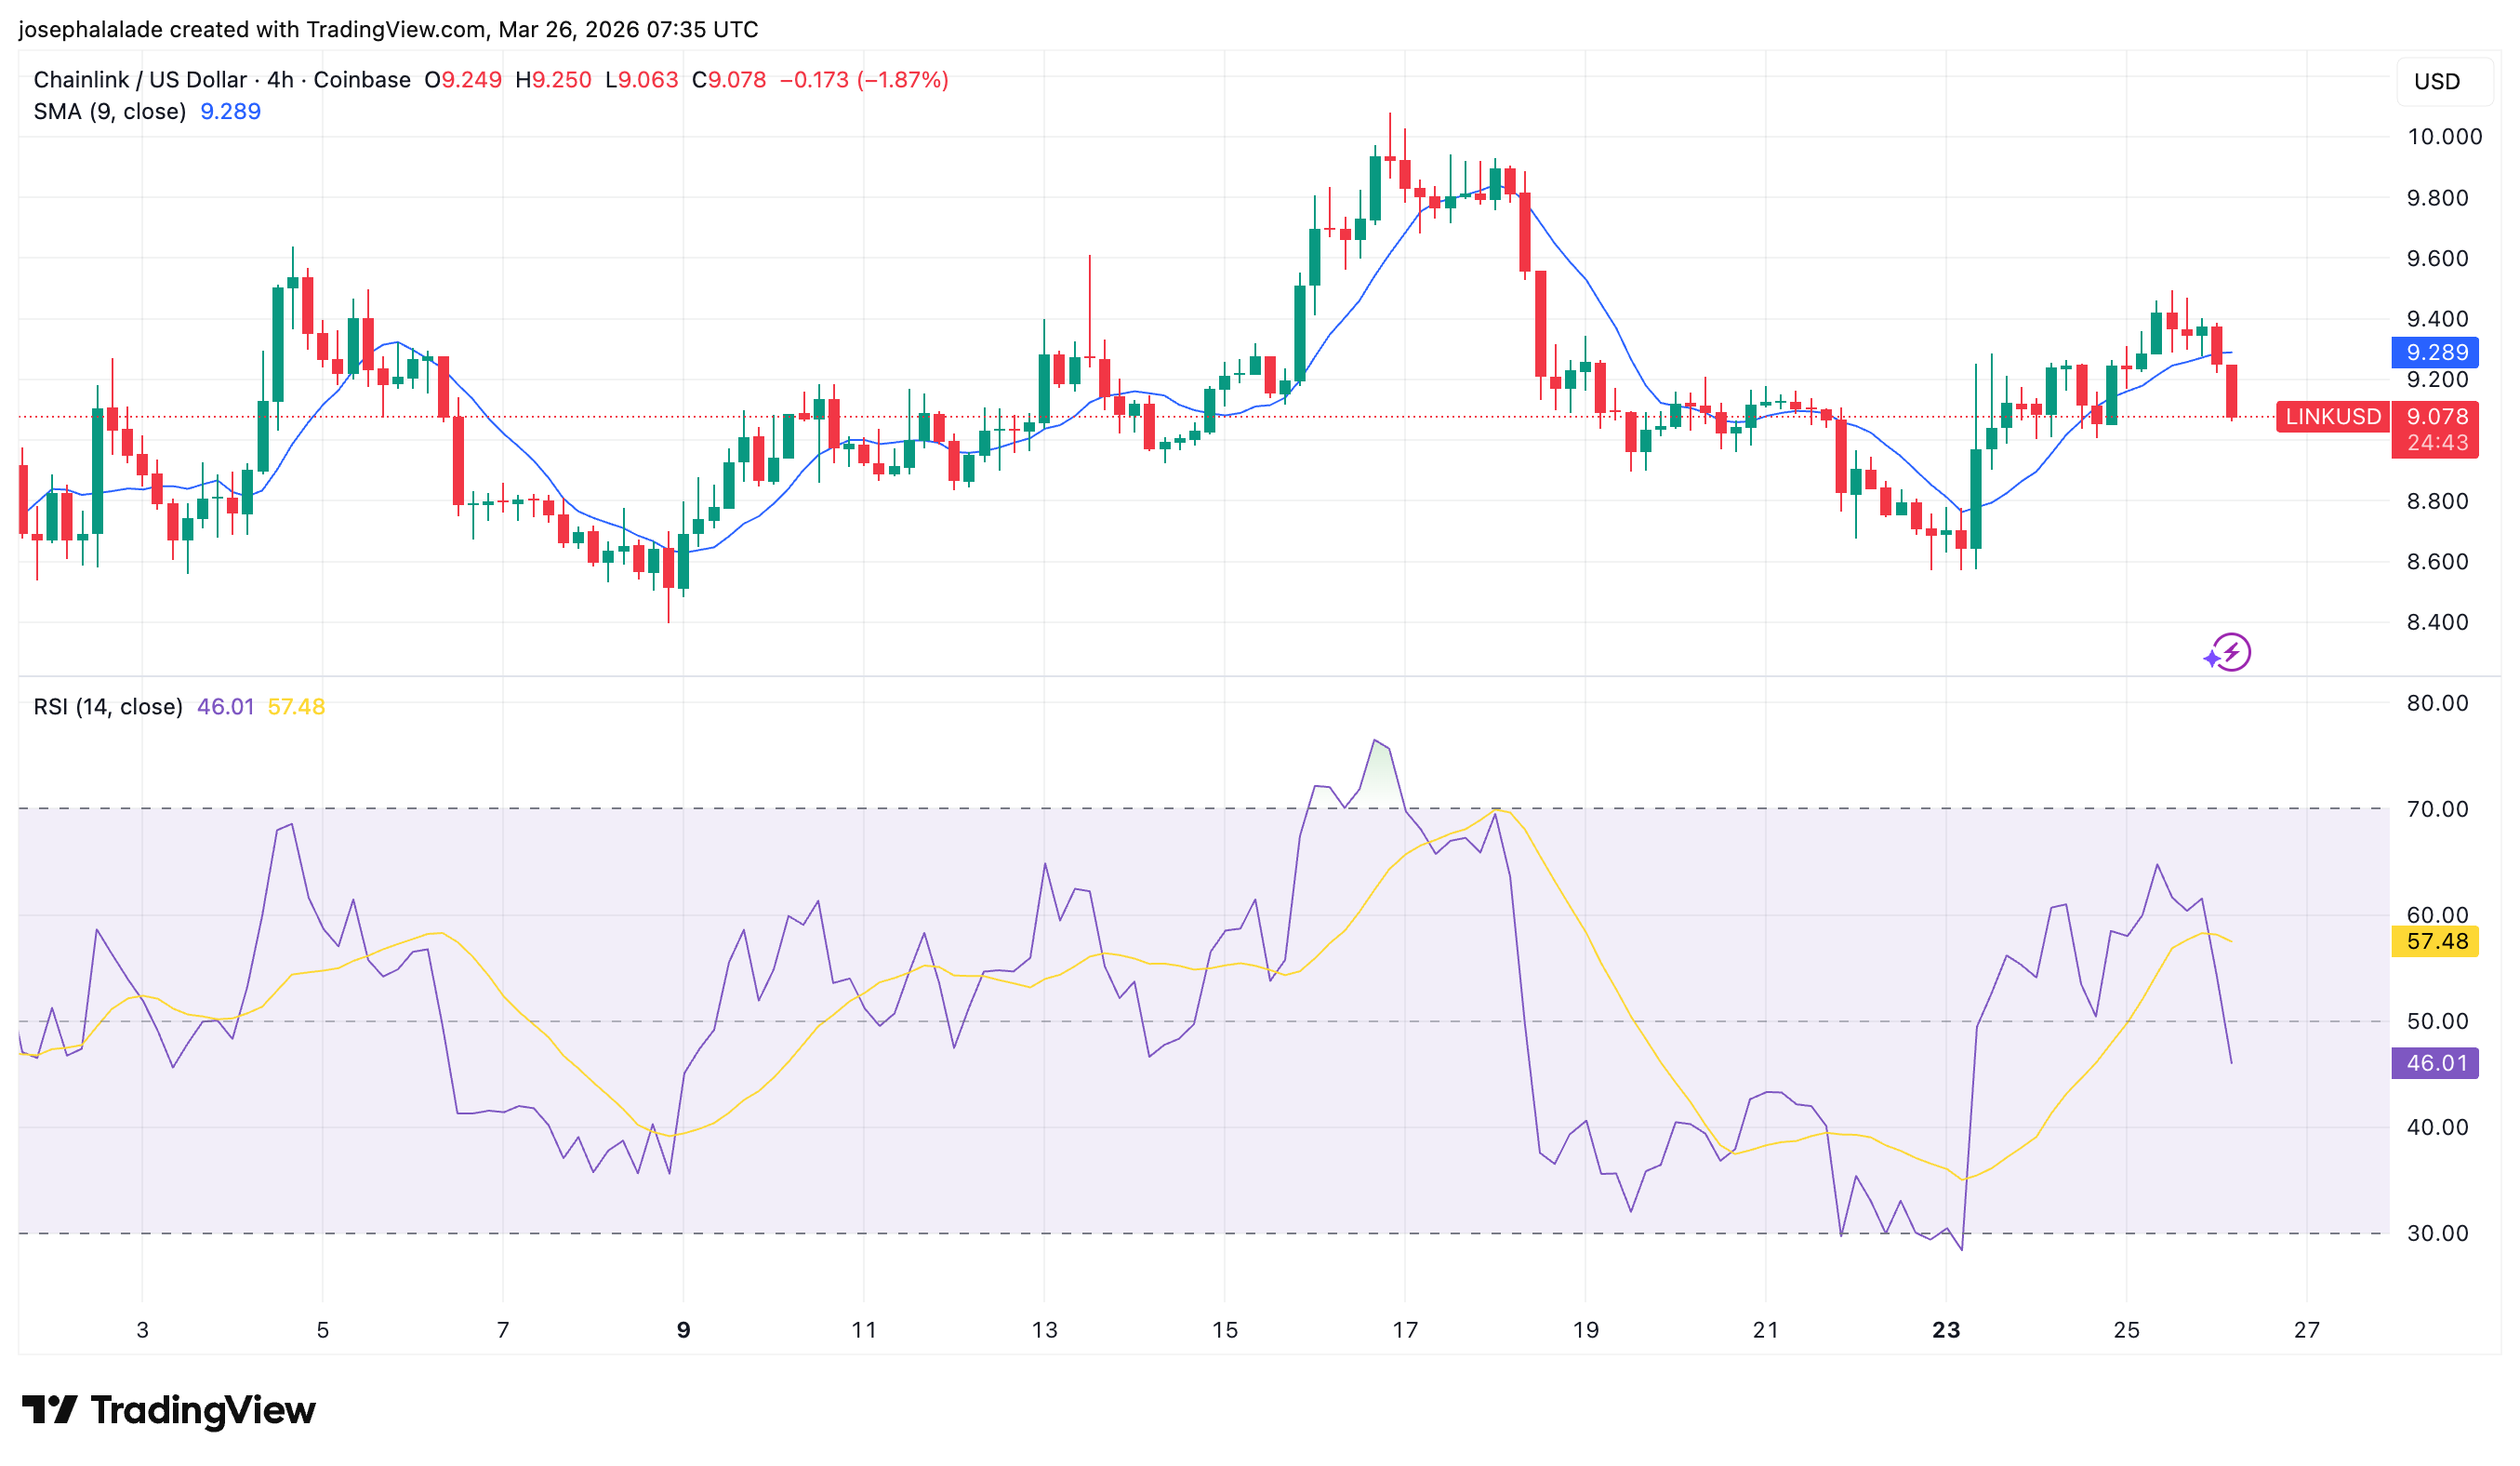
On the 4-hour chart, Chainlink price closed below the SMA(9) at $9.289, and that level immediately flipped to resistance. Price had recovered from the March 21–22 low at $8.60 back toward $9.40, but sellers stepped in before any structure formed.
RSI(14) is now at 46.01 with the signal line at 57.48, a bearish crossover that mirrors the rejection almost tick for tick.
A Chainlink price prediction to the upside requires a 4H close back above $9.289 first. The Chainlink coin structure remains a sequence of lower highs since the March 17 peak near $10.00. Until that flips, the next reference point is the March 21 floor at $8.60.
READ MORE: ONDO Price Eyes Breakout as Franklin Templeton Tokenizes 5 ETFs on Ondo Finance