


- Gold price has plunged as the Turkish Central Bank starts selling.
- It also dropped amid the rising IAU and GLD ETF outflows.
- US inflation is expected to move over 4% this year, making it hard for the Fed to cut rates.
Gold price continued its strong downward trend on Thursday, falling to a low of $4,385, down 22% from its year-to-date high. This article explores the top reasons the XAU price is crashing.
Turkey is Selling Gold to Defend Lira
For a long time, Turkey was one of the most aggressive gold buyers. Now that the Turkish lira crash is gaining steam, the central bank is selling gold.
Data shows that the Central Bank of the Republic of Turkey (CBRT) sold and swapped 60 tons of gold worth $8 billion. The country now holds gold worth over $135 billion.
Still, some more central banks continue to buy gold. A recent report by the World Gold Council showed that these banks will buy 850 tons of gold this year.
READ MORE: Crypto Crash: Why Altcoins Like Siren, Dogecoin, River, Solana are Going Down
Spot Gold ETFs are Seeing Strong Outflows
Gold price is also falling as investors continue dumping their ETF assets. Data shows that the iShares Gold Trust (IAU) has shed assets for the past 7 consecutive weeks, bringing year-to-date outflows to over $3 billion.
Similarly, the SPDR Gold Trust (GLD) has shed assets over the past four consecutive weeks, with year-to-date losses exceeding $2.67 billion.
These outflows are happening as investors start booking profits after gold jumped to a record high earlier this year.
Soaring Inflation Expectations and Fed Rate Hikes
Meanwhile, the gold price is crashing amid the war, leading to expectations that the Federal Reserve will maintain a hawkish stance. Brent and the West Texas Intermediate (WTI) jumped to $103 and $95, respectively.
Therefore, OECD believes that US consumer inflation will jump to over 4% this year. That will be a big increase from the current 2.4%. As a result, it will be hard for the Federal Reserve to cut interest rates.
The challenge is that the US economy is now heading towards stagflation. A recent report showed that the unemployment rate jumped to 4.4% in February as the economy shed over 92,000 jobs.
Gold Price Prediction: Technical Analysis
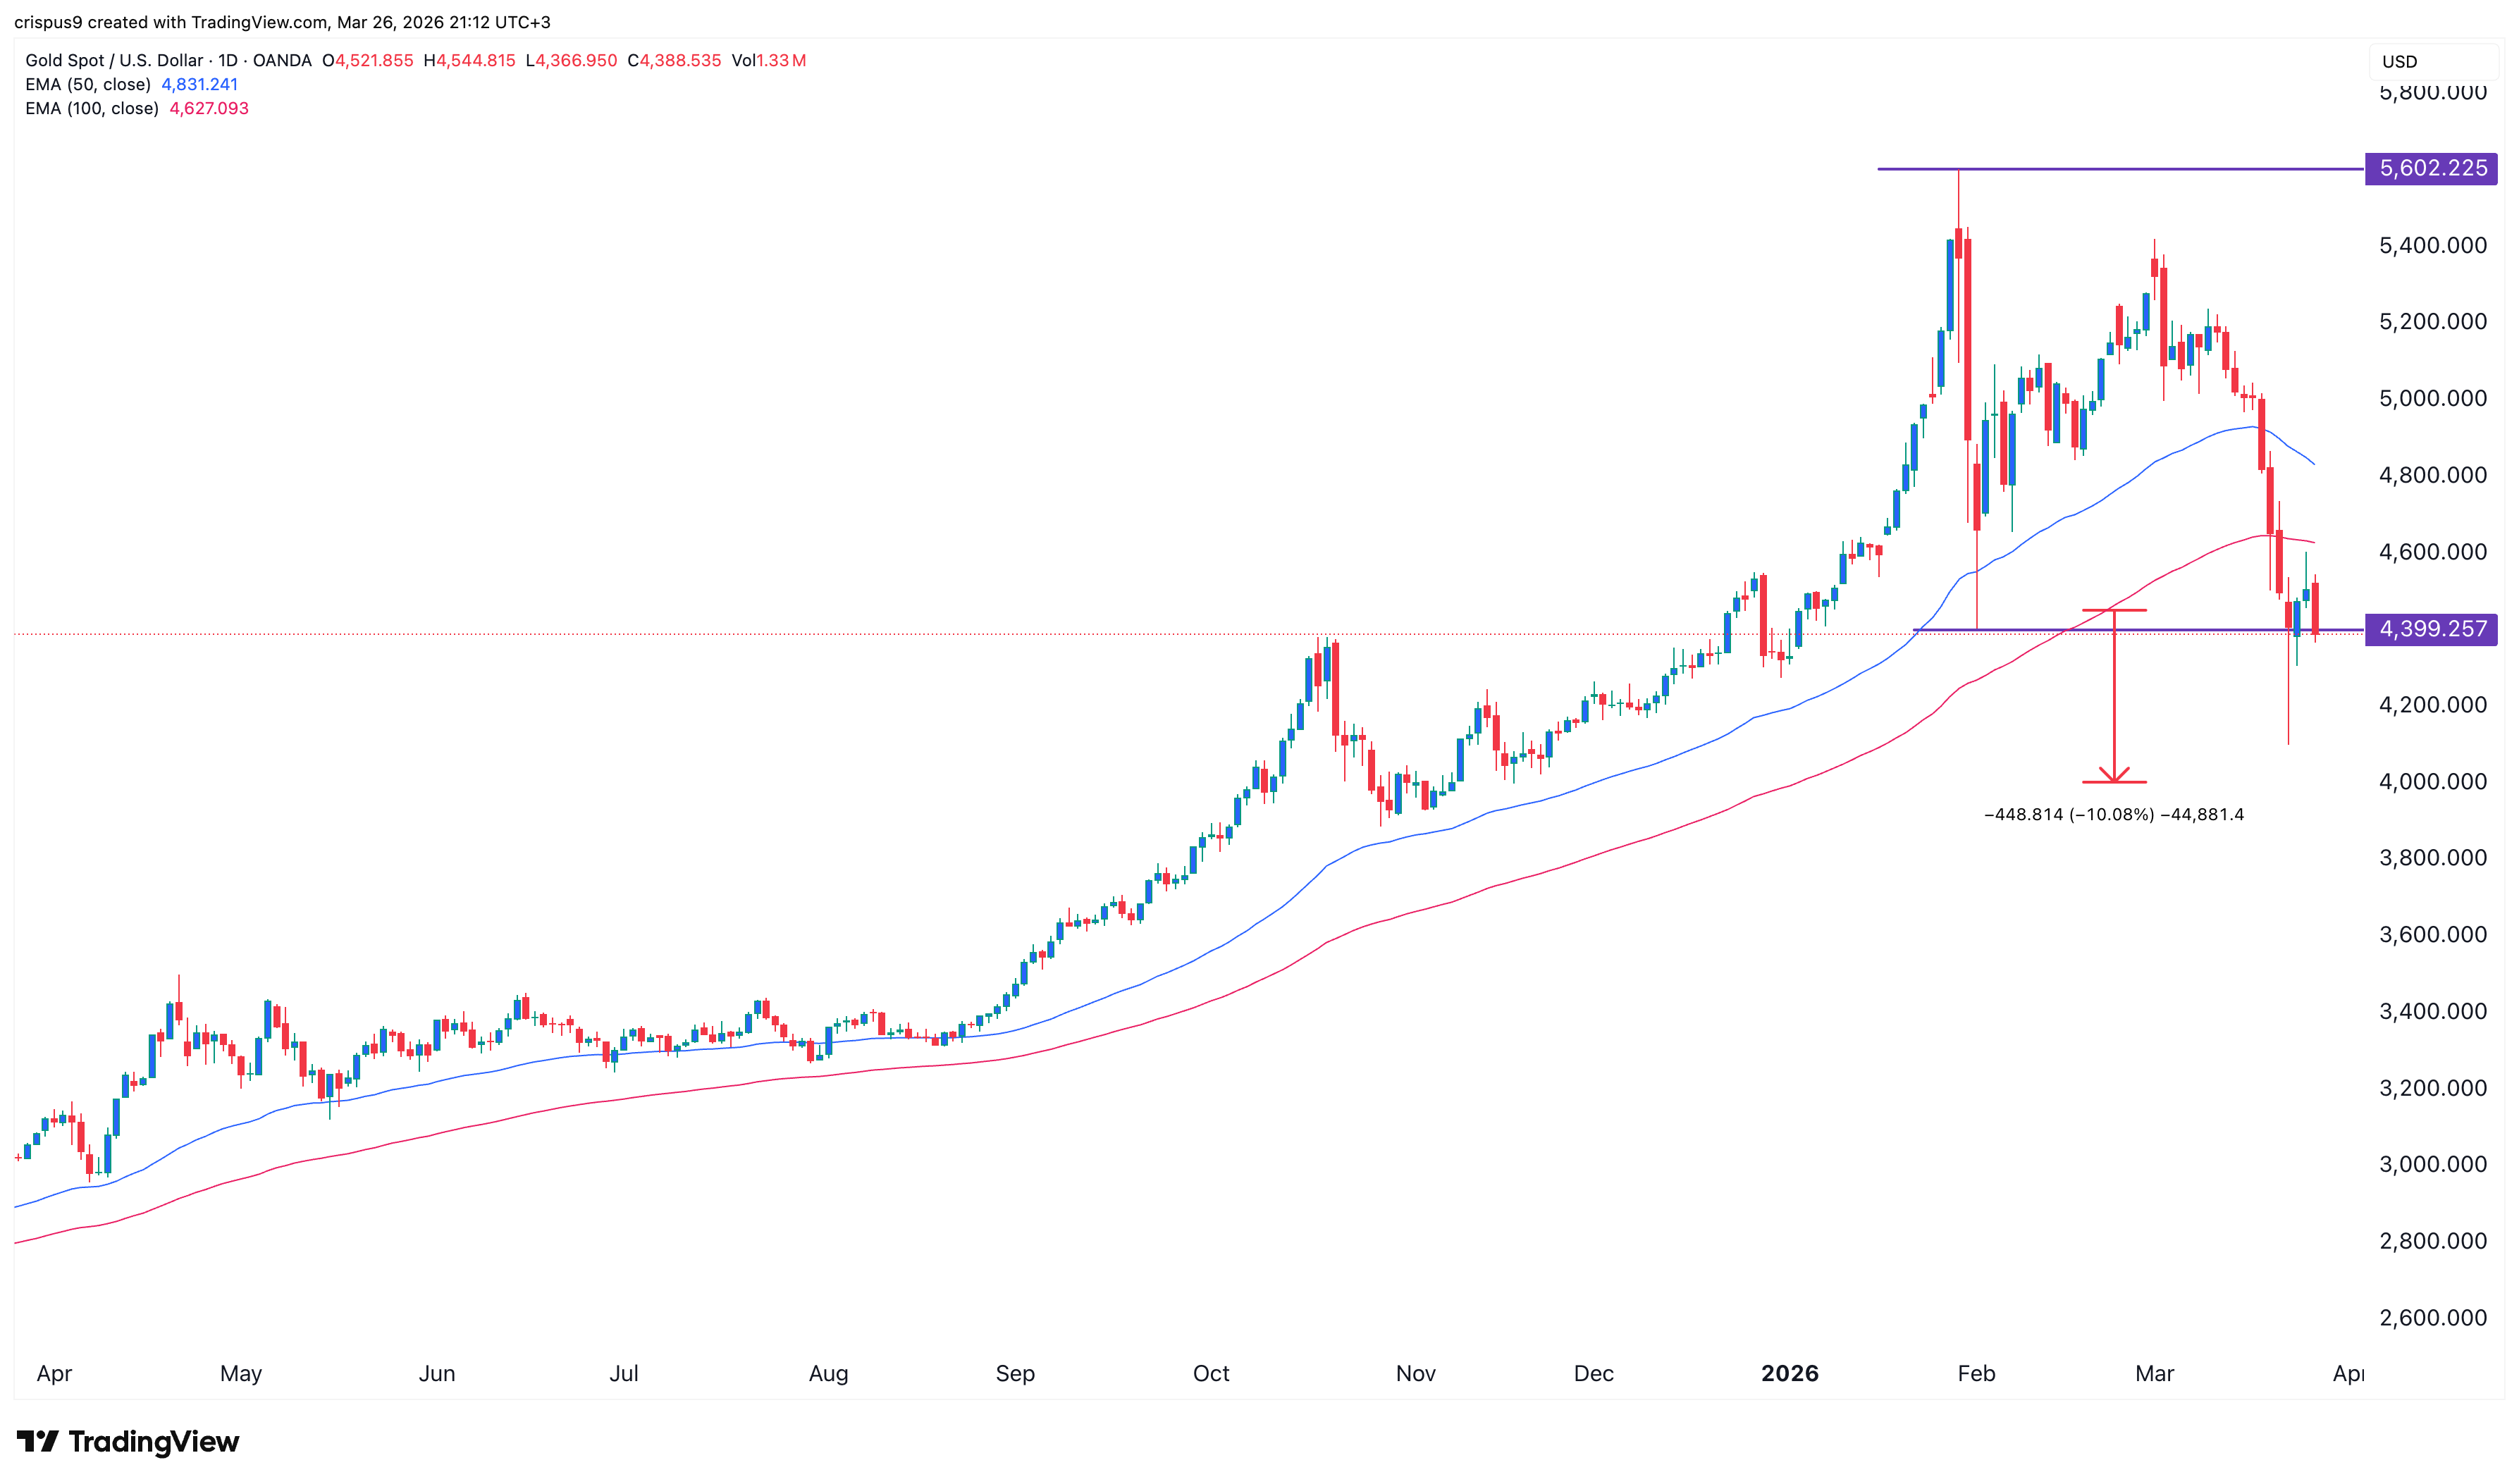
The daily timeframe chart shows that the gold price has plunged from the year-to-date high of $5,603 in January to the current $4,480. It has plunged below the 50-day and 100-day Exponential Moving Averages (EMA).
Gold formed a shooting star candlestick on Wednesday. This pattern consists of a small body and a long upper shadow. It is one of the most common bearish reversal signs in technical analysis.
Therefore, the most likely gold price forecast is bearish, with the next target at $4,000, about 10% below the current level.
READ MORE: Pi Network Price On Edge as Kraken Volume and Liquidity Fade