


The MSTR stock has sold off recently and is hovering near its lowest level since February 24. Strategy was trading at $121, down substantially from its all-time high of $540. This article explores some of the top reasons why the MicroStrategy stock is on the cusp of a strong bearish breakdown.
MSTR Stock at Risk as Bitcoin Forms Dangerous Patterns
Strategy’s business is directly affected by Bitcoin’s performance due to its large holdings. While the company did not buy Bitcoin last week, it now holds 762,099 coins worth over $51.6 billion. A Bitcoin rebound will always push the value of its holdings higher and vice versa.
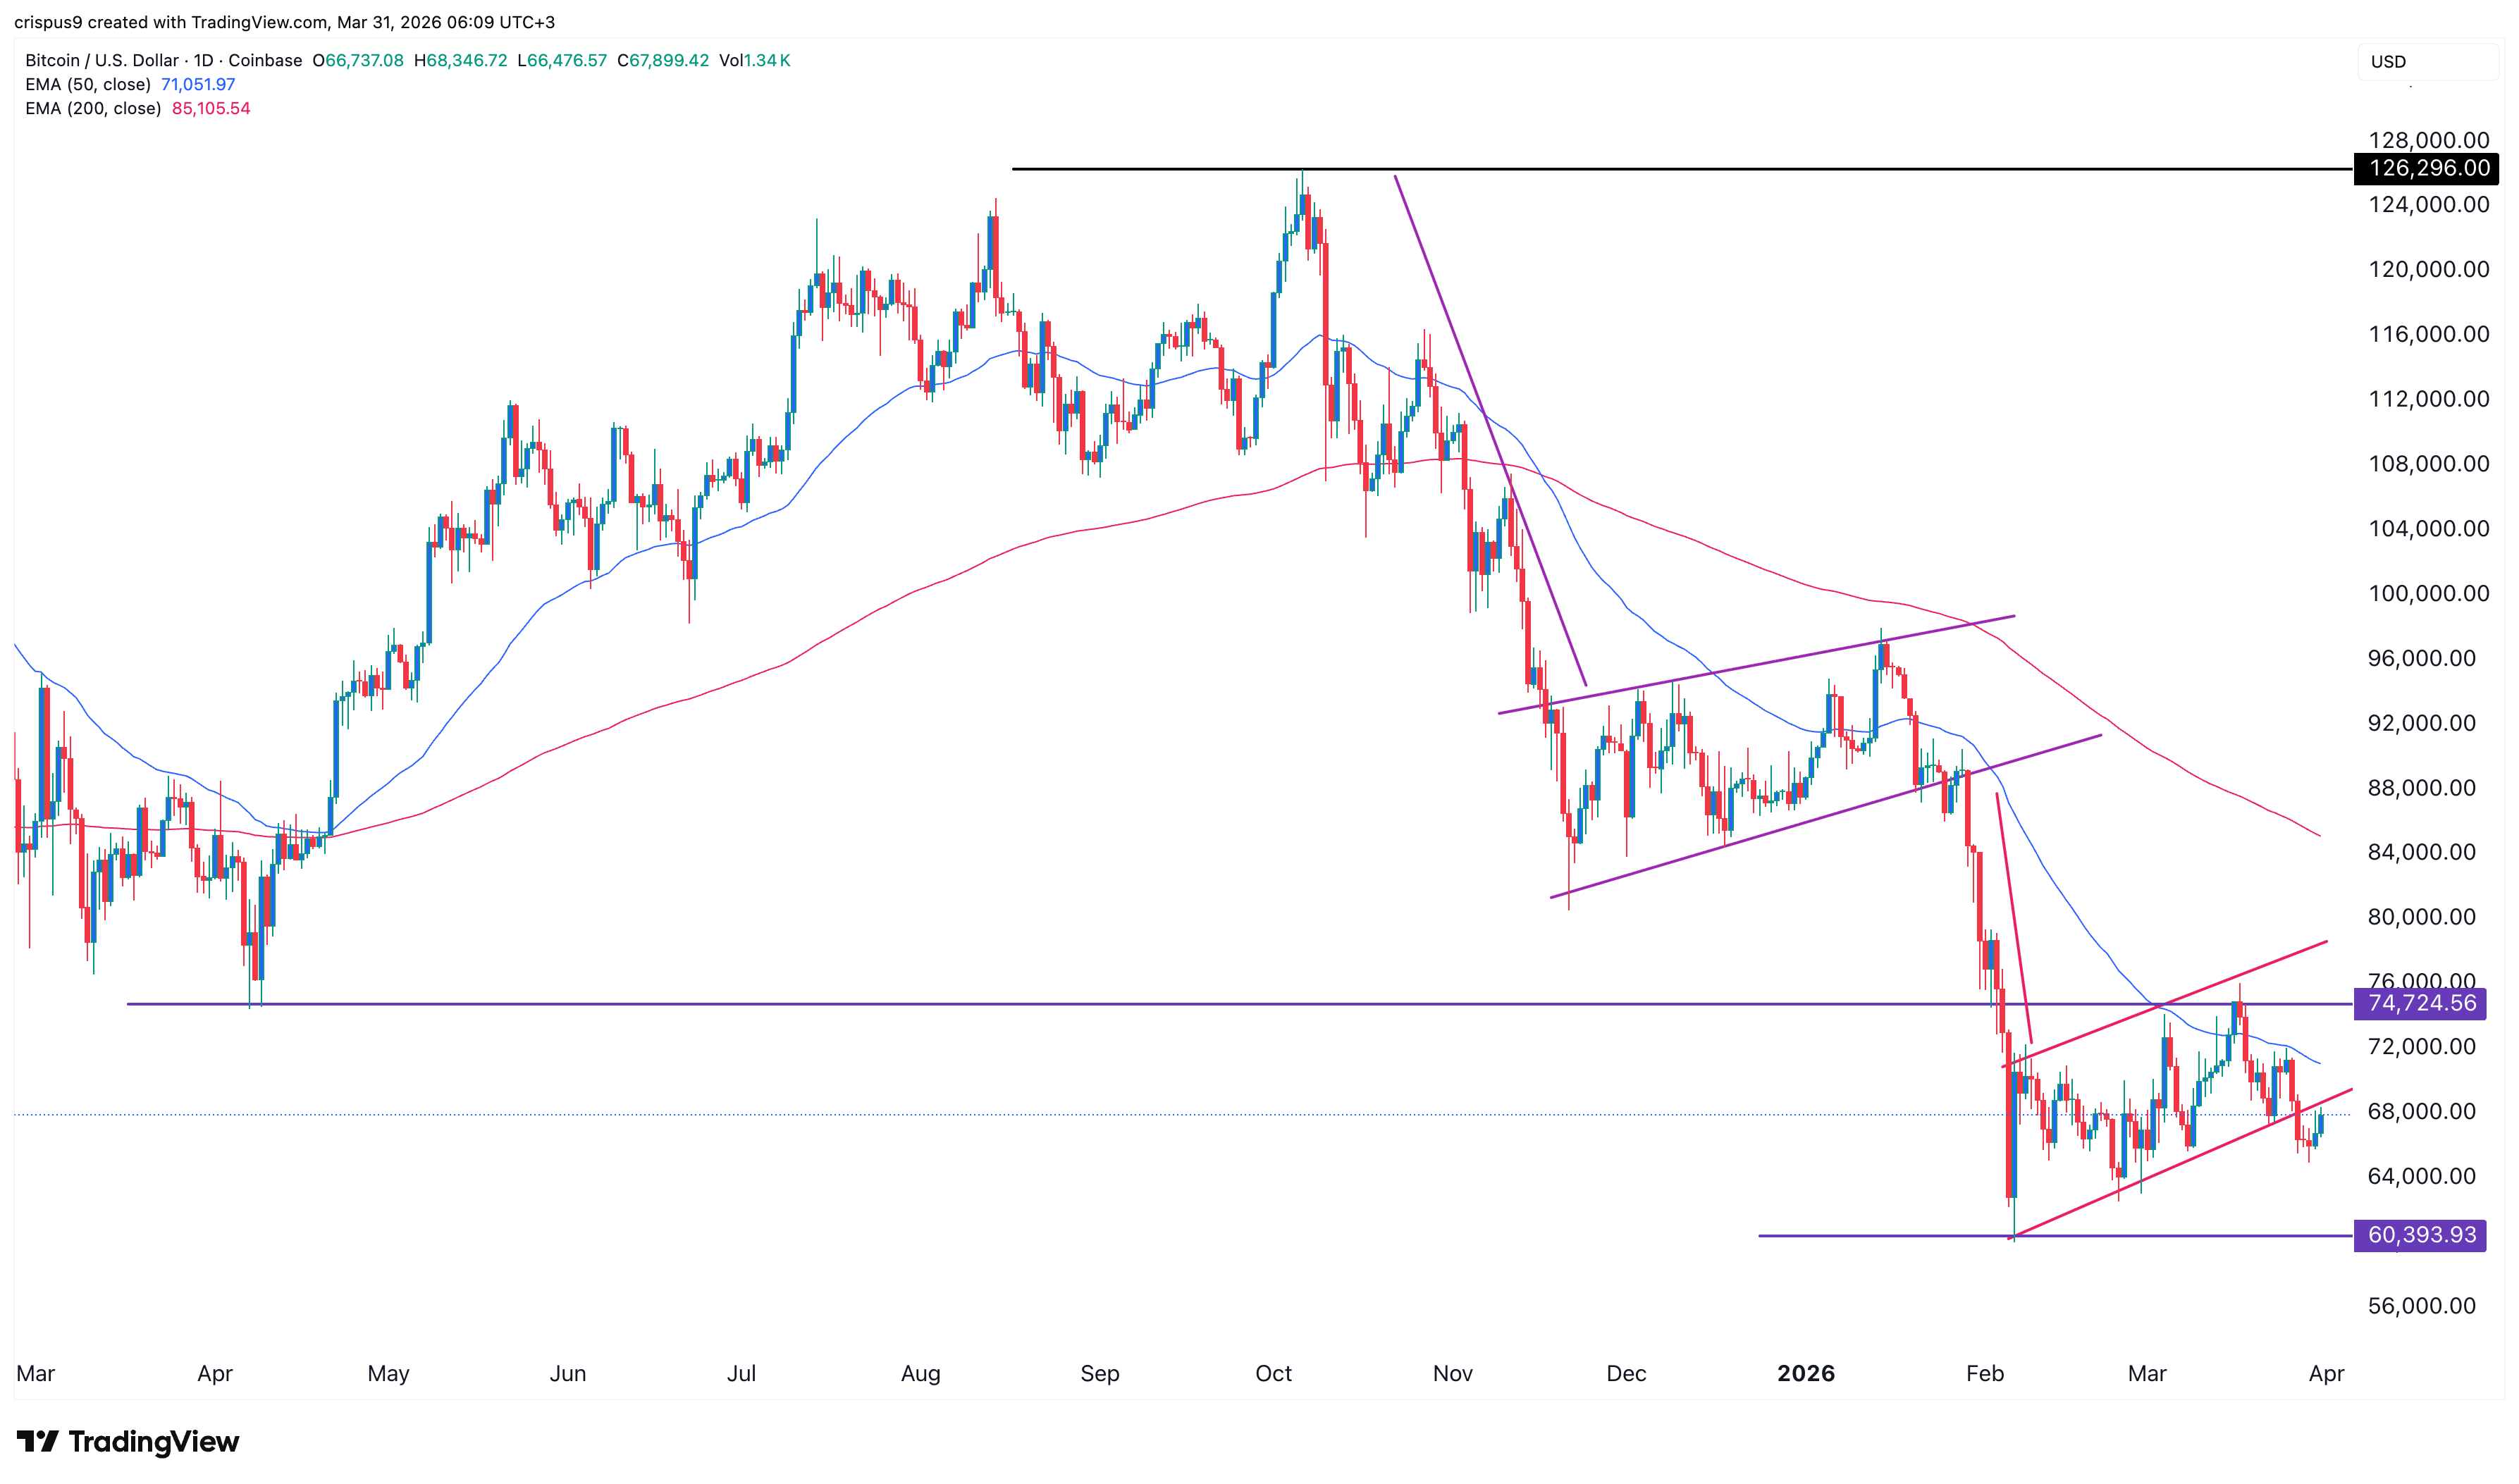
The three-day timeframe chart shows that the BTC price has formed a bearish flag pattern, characterized by a steep decline followed by consolidation. It has already formed the initial flagpole section and is now in the flag section.
READ MORE: Block Stock: Is Jack Dorsey’s XYZ a Bargain or a Value Trap?
Most notably, Bitcoin has already moved slightly below the lower side of the ascending channel, confirming the bearish outlook. A closer look shows that the coin formed a similar pattern between October last year and January this year.
Bitcoin price has remained below all moving averages and the Supertrend indicator, a sign that bears are in control. Therefore, the coin will likely resume its downward trend, possibly reaching the year-to-date low of $60,393.
A drop below that level will signal more downside, possibly to the next important target at $50,000. Such a move will lower the value of its Bitcoin holdings from $51.7 billion to over $38 billion.
MSTR Stock Price Has Also Formed Bearish Chart Patterns
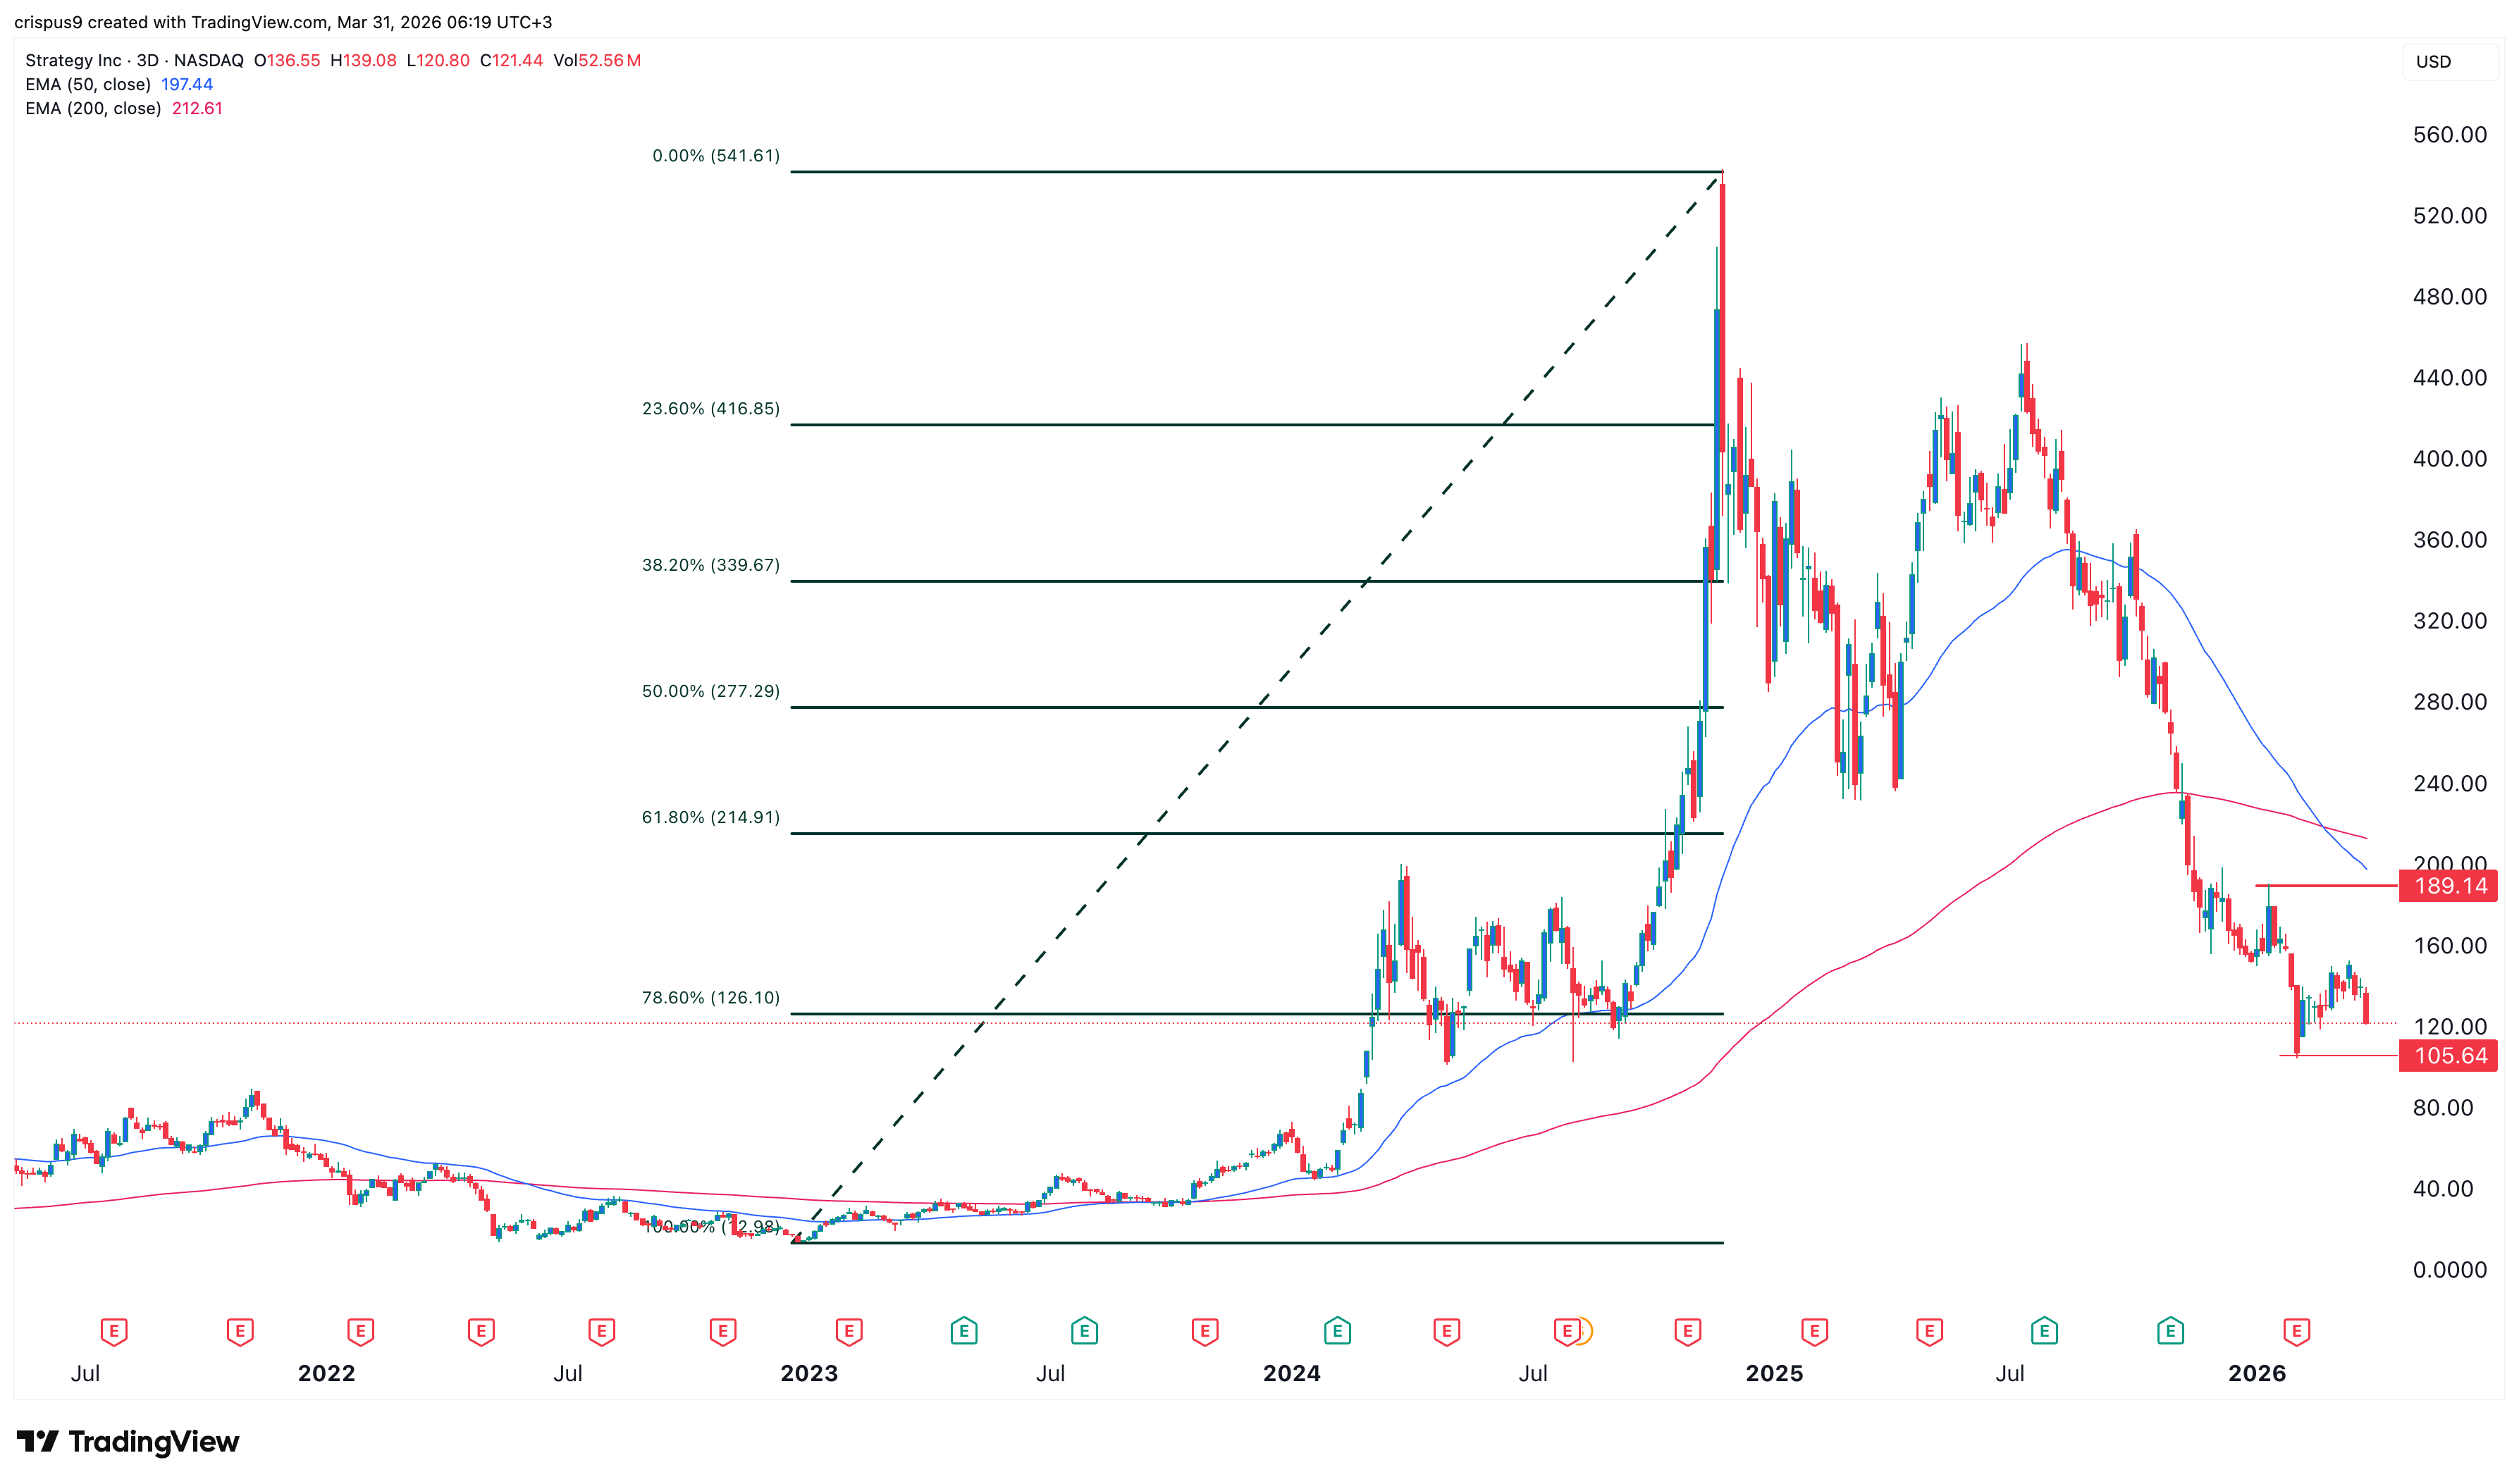
The Strategy stock price has also formed bearish chart patterns. The three-day timeframe chart shows the stock has reached the 78.6% Fibonacci Retracement level.
It has also recently formed a death cross pattern, as the 50-day and 200-day Exponential Moving Averages (EMAs) have crossed. This cross occurred on February 20th, suggesting the stock may continue to fall.
The stock has remained below the Ichimoku cloud and the Supertrend indicators, a sign that bears remain in control this year. Also, the Relative Strength Index (RSI) and the MACD indicators have continued to fall over the past few months.
Therefore, the most likely scenario is that the Strategy share price continues to fall, potentially to its year-to-date low of $105. A drop below that level will point to further downside, potentially to below $100.
Strategy has some notable weaknesses in its fundamentals, including ongoing dilution for investors, with the number of outstanding shares rising from below 80 million in 2021 to over 320 million today.
The company has also authorized another 174,815,817 MSTR shares, valued at over $21 billion, and has hinted that it will continue selling shares in the foreseeable future.
Additionally, more investors continue to short the MSTR stock, with the short interest rising to over 12% from below 5% last year.
READ MORE: IREN Stock Drops Below Key Price as Short Interest Rises Amid Dilution Risks