


SoFi Technologies stock price has crashed by over 50% from its highest point this year amid rising concerns about dilution, growth, and competition. It was trading at $16.27, down substantially from last year’s high of $32.70. This report explains whether it is safe to buy the SoFi Technology stock dip or short it this year.
Why SoFi Stock Price Has Plunged
SoFi Technology stock has dropped sharply this year as more investors have continued shorting the company. Data shows that short interest has jumped to 11% this year, up from a low of 5% last year.
Short sellers are concerned about the company’s dilution following management’s decision to raise capital by selling shares earlier this year. It raised over $1 billion to fund its growth. This fundraising came a year after the company did the same thing. As a result, the number of outstanding shares has jumped to 1.27 billion from 1.1 billion last year.
SoFi stock has also plunged after Muddy Water, a popular research company, published a report accusing the company of manipulating its loan book and having a higher default rate than other similar companies.
READ MORE: PayPal Stock Price is Extremely Cheap: Is it a Value Trap?
It also pointed to the inaccuracies about SoFi accounts, including the Secured Loan program, which has about $312 million in unreported borrowings. Historically, investors often panic when there is a major short-seller report, such as the one Muddy Waters published.
SoFi has denied these claims and maintained the integrity of its business. The most recent results showed that the company’s business continued to perform well in the fourth quarter, with net revenue rising 37% to over $1 billion and EBITDA rising to over $318 million.
The company has benefited from its all-in-one platform, which offers solutions such as banking, credit cards, investment services, loans, and crypto services. Its goal is to capture young people as clients and grow with them over the years.
Analysts expect the upcoming results to provide more information about its growth trajectory, with the average estimate indicating that its revenue rose 36% in the first quarter to over $1.05 billion. The estimate is that the annual revenue will jump by 30% to $4.6 billion, followed by $5.2 billion next year.
SoFi Technologies Stock Price Technical Analysis
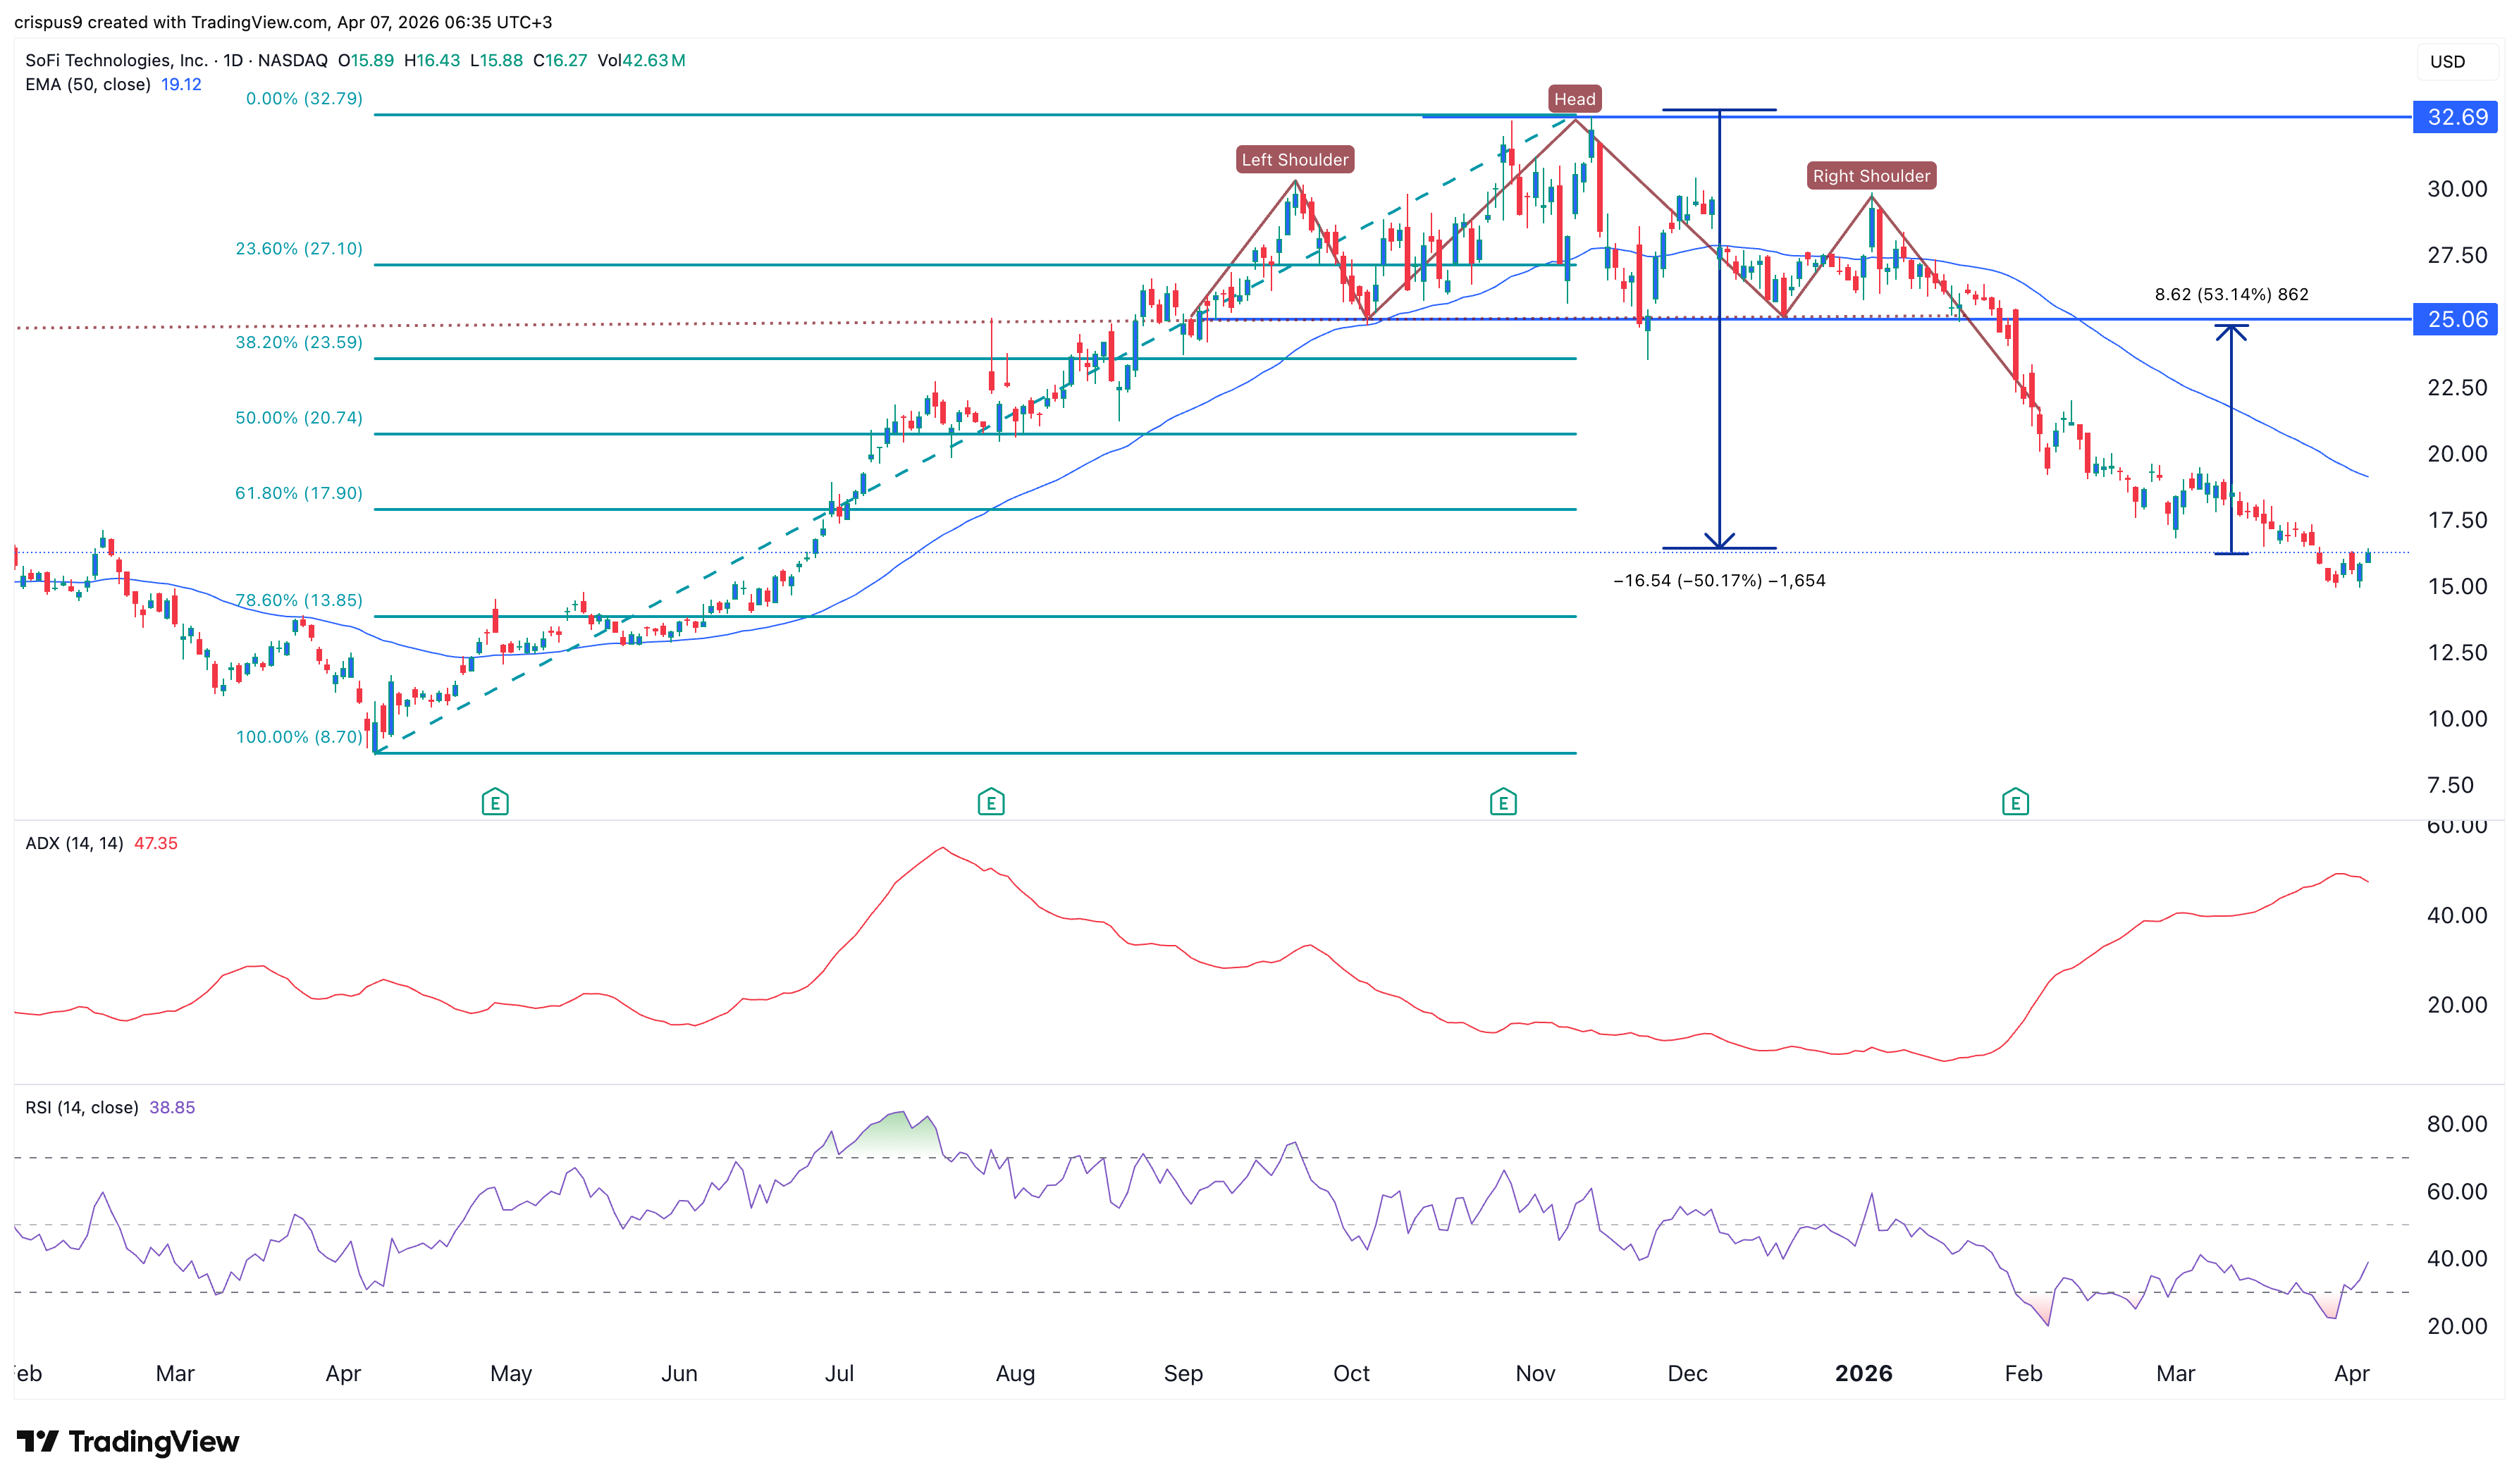
The daily timeframe chart explains why the SoFi share price crashed. It formed a giant head-and-shoulders pattern between September 2nd and January this year when it moved below the neckline.
By measuring the distance from the head and the neckline, we see that it is trading at the pattern’s target.
It has moved below the 61.8% Fibonacci Retracement level and is slowly forming a falling wedge pattern, which often leads to a strong bullish breakout. The Average Directional Index (ADX) has been moving sideways over the past few days, a sign that selling momentum has faded.
Therefore, the most likely scenario is where the stock bounces back in the near term, especially when it publishes its financial results. If this happens, the next key target to watch will be at $25, the neckline of the head-and-shoulders chart pattern, which is about 52% above the current level.
READ MORE: CoreWeave Stock Nears Breakdown as Short Interest Hits 15%