


- Nio stock price has formed a cup-and-handle pattern.
- It has also formed a golden cross pattern on the daily chart.
- Chinese EV exports jumped to a record high in March.
Nio stock price continued to rise this week as investors cheered its profitability progress and the ongoing surge in deliveries. This surge may continue this year as the stock has formed a golden cross and a cup and handle chart pattern.
Nio Stock Boosted by Soaring Demand and Profitability Shift
Data released today, April 9, shows that demand for Chinese electric vehicles is soaring in the country and abroad as the soaring fuel prices make EVs more appealing.
Chinese EV exports jumped to a record high in March this year. They spiked by 140% to 349,000, with BYD and Geely leading the charge. Other smaller companies like Nio and XPeng have also seen a surge overseas in the past few months.
A recent report showed that Nio’s strategy to diversify its vehicle lineup is boosting its sales and profits. In addition to its flagship Nio brand, the company launched ONVO and Firefly to target diverse clients.
READ MORE: New BlackRock Bitcoin ETF Will Pay a Big Dividend: Will it Be Better Than IBIT?
Nio’s deliveries jumped by 136% in March to 35,486, bringing the quarterly figure to 83,465. It has now delivered over 1.08 million vehicles since its inception. These deliveries are notable because many large companies like Tesla and BYD missed their estimates.
The first quarter deliveries came shortly after the company published strong results, which showed that its business continued growing as its profit rose for the first time ever.
Its revenue surged by 75% to $4.9 billion, while the net profit was $40 million. For the year, its revenue jumped to $12.5 billion, while its net loss narrowed to $2 billion.
Analysts believe that the company’s growth will remain at an elevated level this year. The average estimate among 23 analysts tracking the company is that its revenue will jump by 47% this year to 128 billion CNY ($17 billion) followed by 149 billion a year later.
Nio’s growth strategy is based on growing its market share in China and other countries, especially in Asia, Middle East, Europe, and South America. This growth explains why the company’s short interest has continued to fall in the past few weeks. It has dropped from 10% to 6% today.
Nio Stock Price Technical Analysis
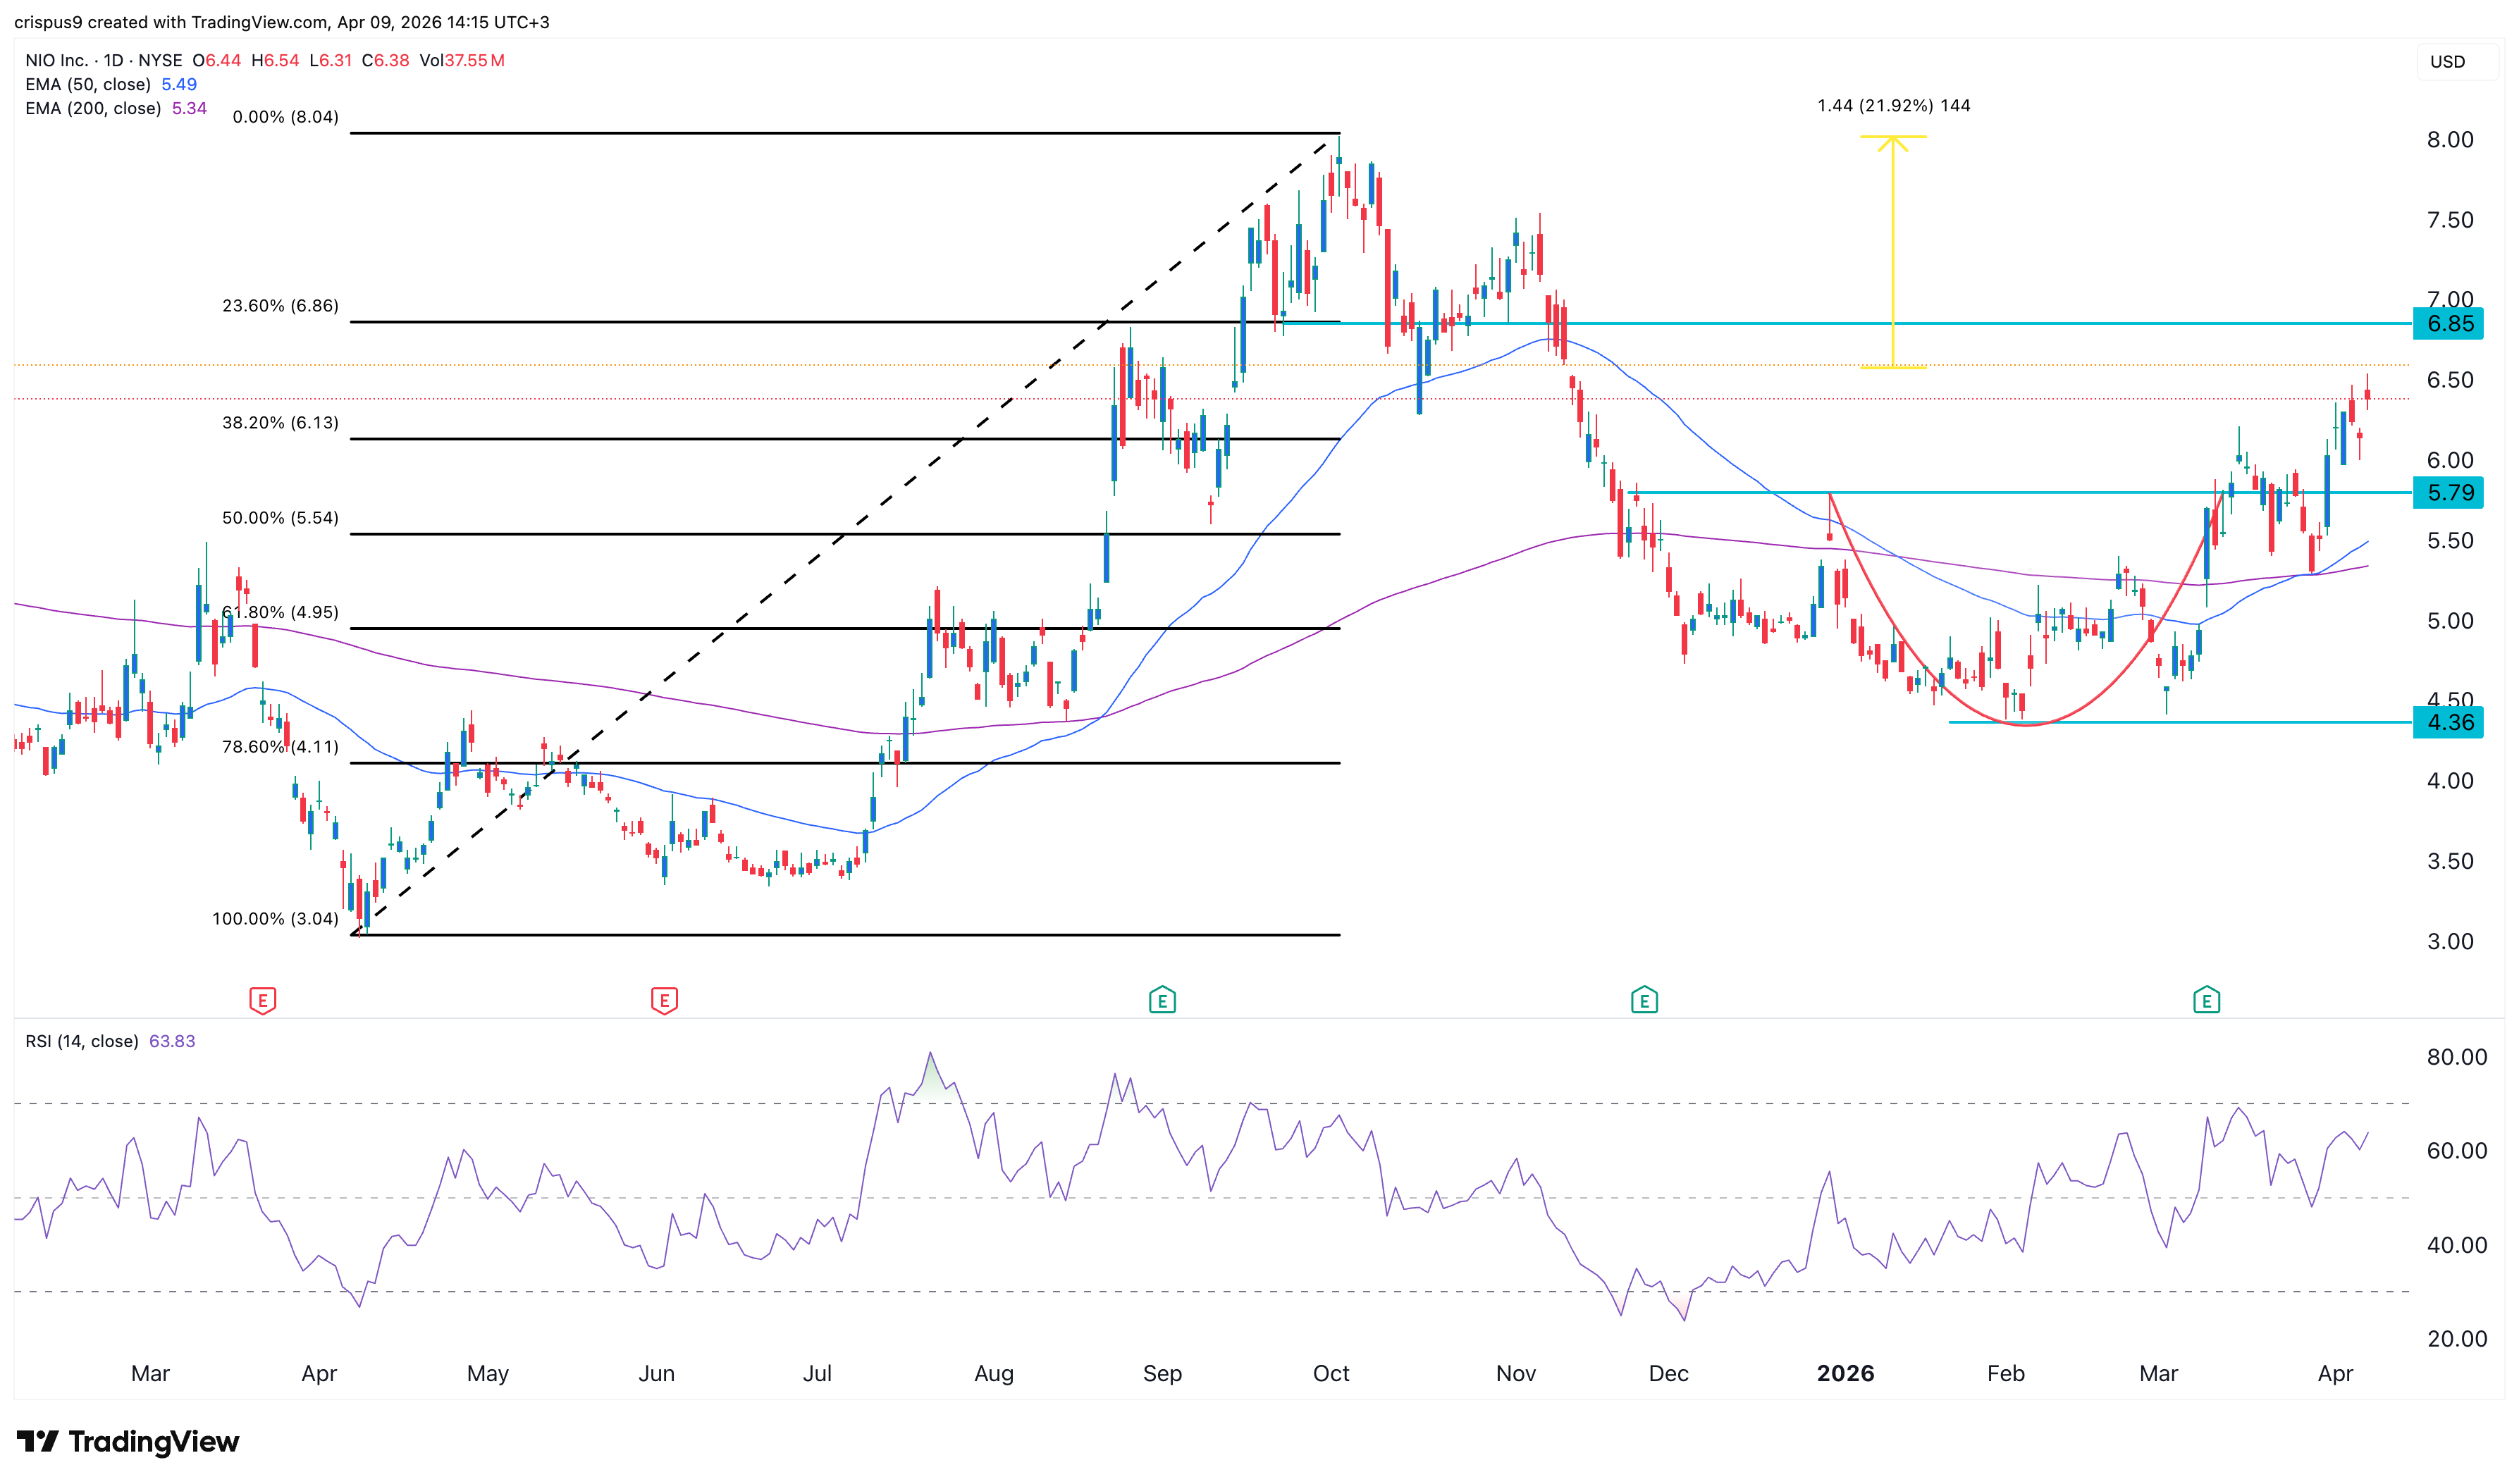
Nio share price chart | Source: TradingView
There are signs that the Nio share price has more room to grow in the near term. It has already jumped above the crucial resistance level at $5.80, the upper side of the cup-and-handle pattern. C&H is a popular bullish continuation pattern.
The stock has also formed a golden cross pattern as the 50-day and 200-day Exponential Moving Averages (EMA) crossed each other. It has also jumped above the 38.2% Fibonacci Retracement level.
The Relative Strength Index (RSI) and the MACD indicators have continued rising, a sign that the momentum is continuing.
Therefore, the stock will likely continue rising, with the next key target being at last year’s high of $6, which is about 22% above the current level. A drop below the key support level at $5.80 will invalidate the bullish outlook.
READ MORE: Pepe Coin Price Prediction as Canary Files For New Spot PEPE ETF