


- Circle stock price has pulled back in the past two weeks.
- A Compass Point analyst expects the stock to retreat to $77.
- The stock is in the second phase of the Elliot Wave pattern.
Circle stock price has lost momentum in the past two weeks as it dropped from a high of $134 on March 16 to the current $85. The retreat continued on Thursday after an analyst at Compass Point downgraded it and placed a target of $77. Still, CRCL is in the process of forming an Elliot Wave, pointing to an eventual rebound.
Circle Stock Price Dropped After an Analyst Downgrade
CRCL stock dropped after Ed Engel, a senior analyst at Compass Point, downgraded it and slashed the price target from $79 to $77.
He pointed to margin risks and its stretched valuation, considering that the company is now valued at $21 billion, giving it a 40x EBITDA estimate of 2027.
While Circle stock is clearly overvalued, there are some potential catalysts that may boost its performance over time. The most important is that stablecoins are the future of payments because of their low transaction costs.
For example, sending 10,000 USDC stablecoin on Solana costs less than $3. In contrast, sending the same amount on PayPal costs between $290 and $300, and the recipient will typically spend more money.
READ MORE: Pepe Coin Price Prediction as Canary Files For New Spot PEPE ETF
Therefore, the stablecoin industry is still young, and, in the future, companies will embrace it in various ways. Indeed, companies like Amazon and Walmart that handle billions of dollars a month are exploring how to use these tokens.
Circle, being the biggest American stablecoin company, will benefit from this transition. Besides, in addition to offering the USDC stablecoin, the company has also launched the Circle Payment Network (CPN), which aims to disrupt the Swift network.
The other main catalyst for the CRCL stock price is that the amount of USDC in circulation has continued soaring this year and now stands at nearly $80 billion, while its volume in the last 30 days jumped to over $7 trillion.
Therefore, coupled with higher interest rates, there is a possibility that Circle’s revenue growth will continue to accelerate this year. Analysts expect that its annual revenue will be $3.2 billion, followed by $4.34 billion next year.
Compass Point is right that the company may experience margin pressure as it continues to expand its business by launching more solutions. However, this margin issue will likely be temporary as the USDC in circulation will likely soar to over $200 billion in the coming years.
CRCL Stock Elliot Wave Analysis
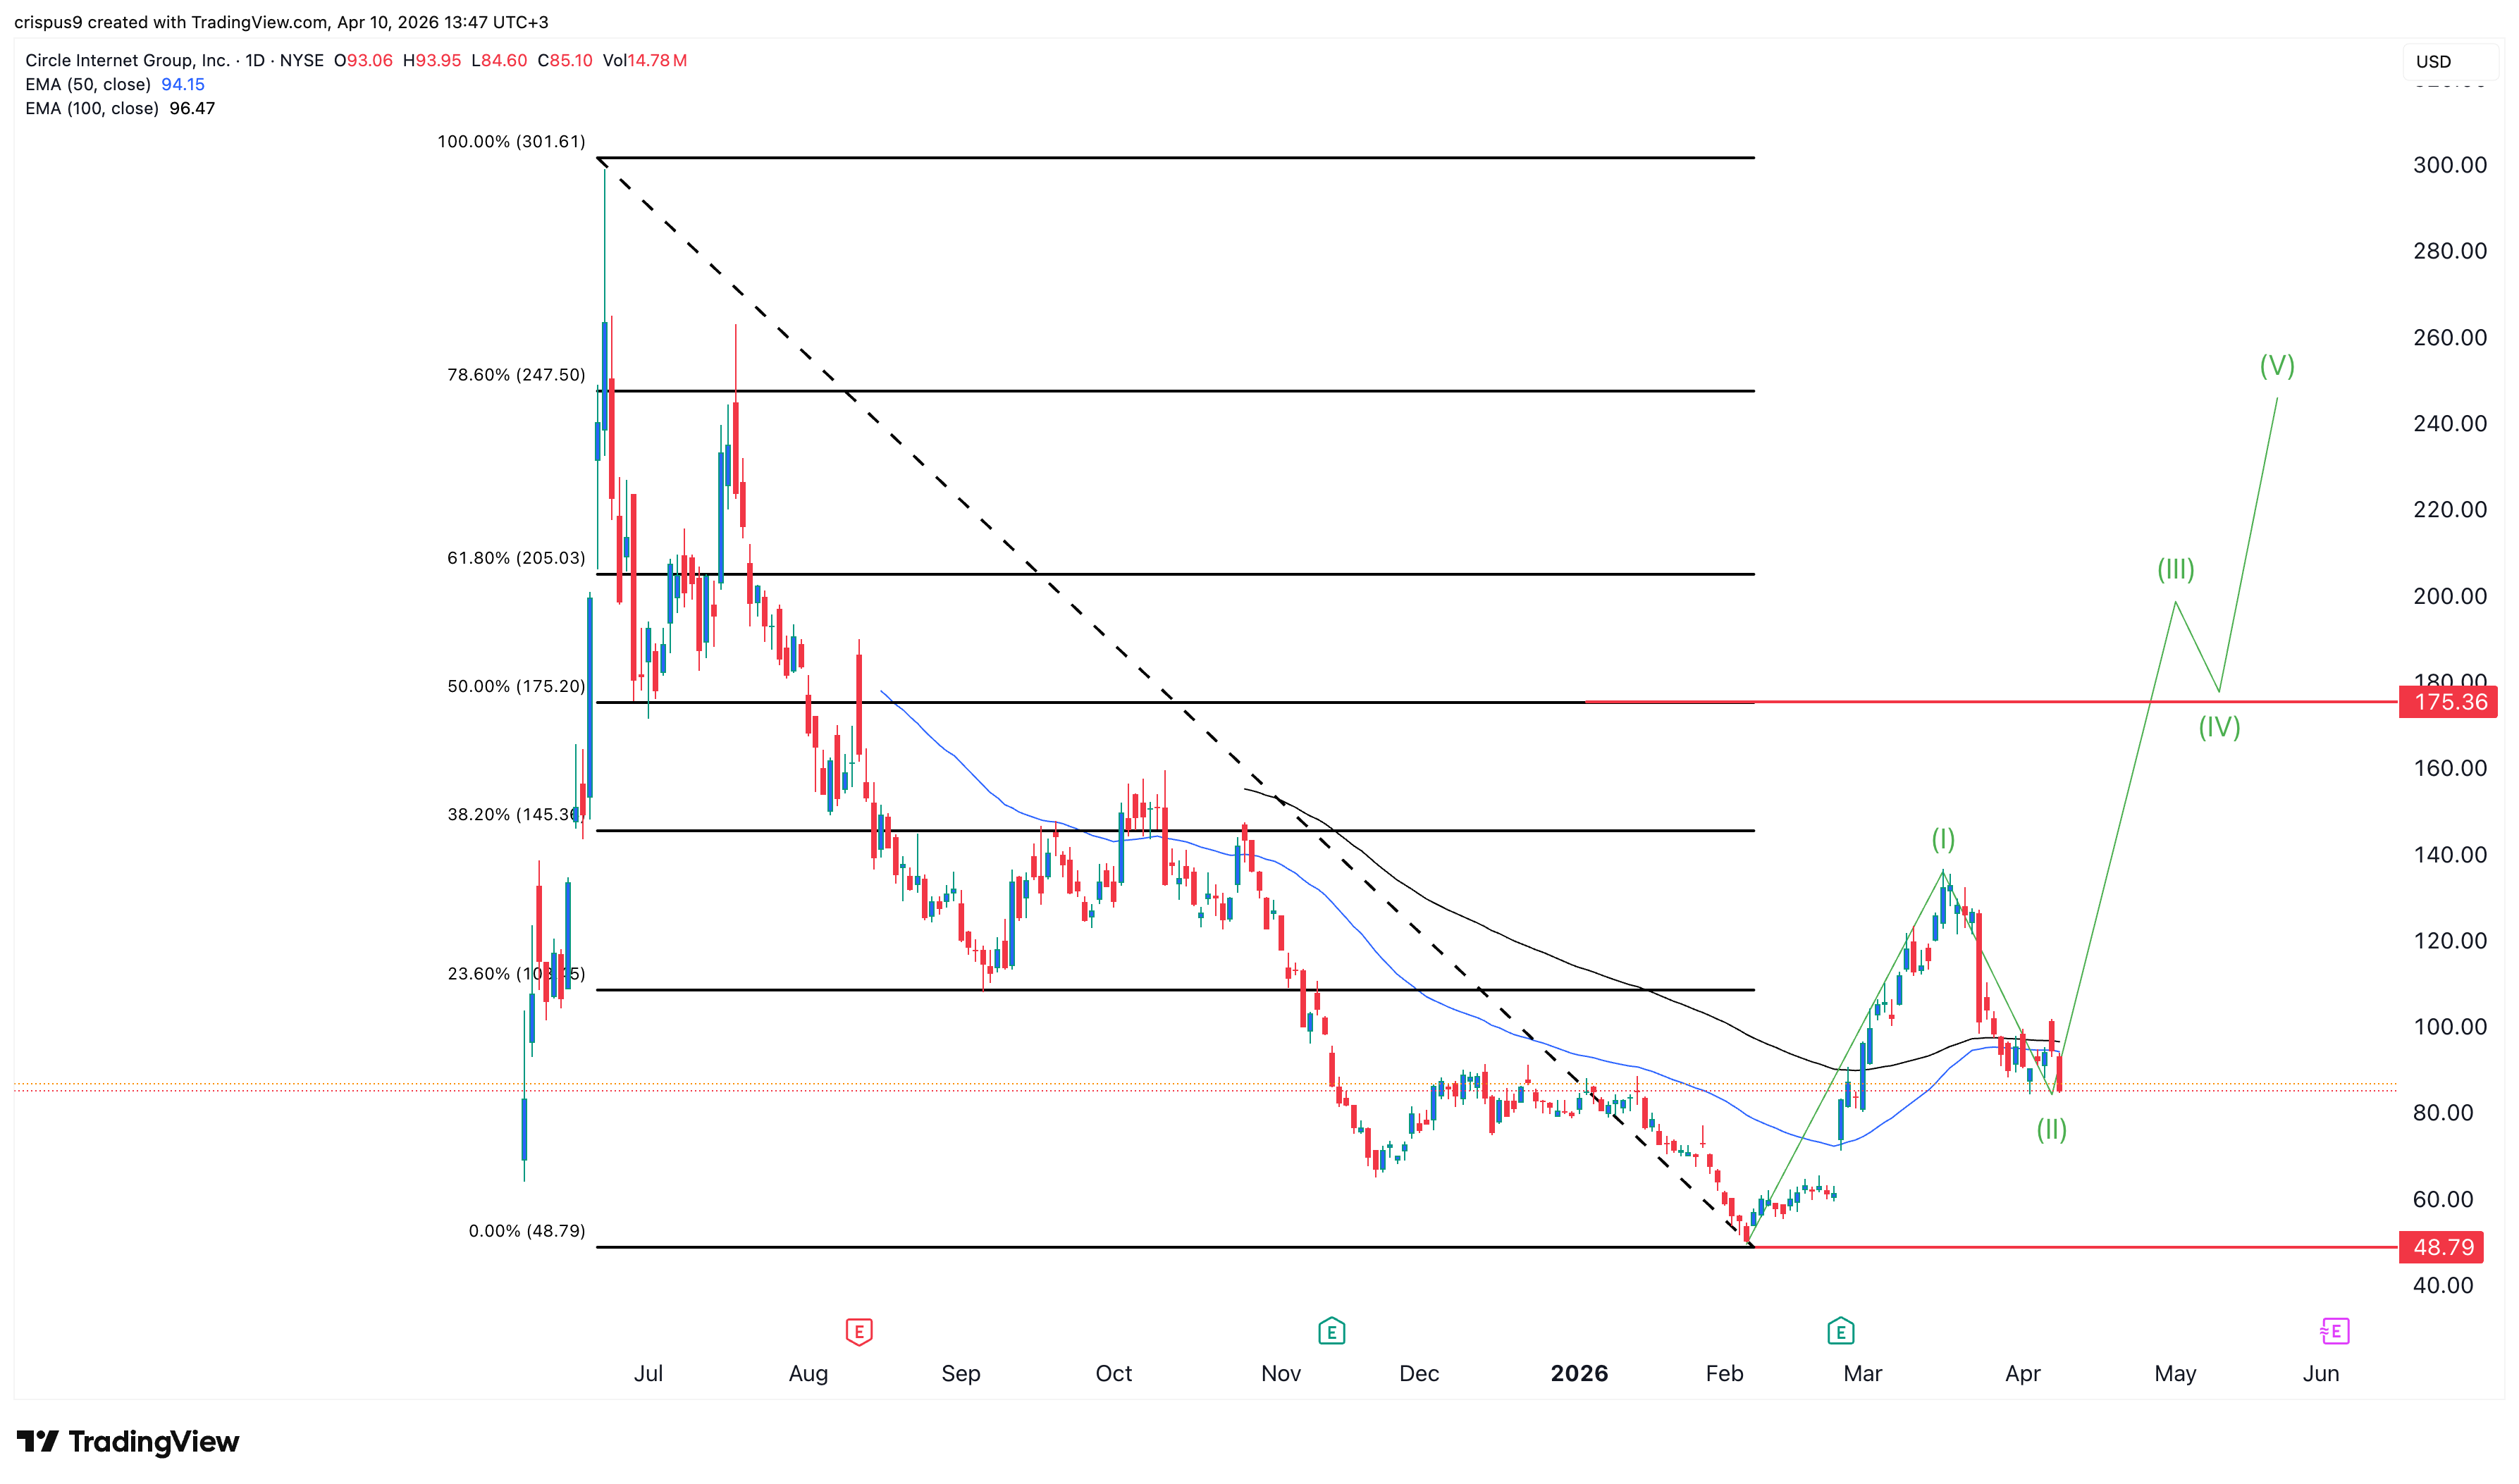
The ongoing Circle share price crash is either one of two things: the second phase of the Elliot Wave pattern or part of the formation of a double-bottom pattern at $48.
The second phase of the Elliot Wave pattern is usually a bearish one and is then followed by the third one, which is normally the longest one.
If this is the case, then the stock will likely rebound and initially retest the year-to-date high of $136, which is about 56% above the current level. A move above that level will point to more gains to the 50% retracement level at $175.
On the other hand, if it is forming a double-bottom pattern, it means that it will continue falling to $48.7 and then rebound. A double-bottom is one of the most common bullish reversal signs in technical analysis.
READ MORE: Zcash, Dash, Monero Prices Jump as Iran Considers Crypto for Strait of Hormuz Tolls