- Bitcoin price has rebounded to the highest point since February.
- The Crypto Fear and Greed Index jumped to the greed zone.
- Futures open interest and ETF inflows are soaring.
Bitcoin price held steady above the key resistance level at $77,000 as BTC ETF inflows and futures open interest rose, and as the Crypto Fear and Greed Index roared to the greed zone. BTC was trading at $77,170 on Saturday morning, up sharply from the year-to-date low of $60,000.
Bitcoin Jumps as Fear and Greed Index Rises and ETF Inflows Soar
BTC joined other risky assets in a strong rally on Friday as President Donald Trump touted the reopening of the Strait of Hormuz, through which over 20% of all crude oil passes. As a result, crude oil prices plunged while risky assets soared, with the S&P 500 and Nasdaq 100 indices rising to record highs.
The announcement sparked a sense of greed in the market, with the Fear and Greed Index soaring into the greed zone at 61. It is the first time in months that the gauge has moved to this zone. Cryptocurrencies often do well when there is a sense of greed in the market.
READ MORE: Best Crypto to Buy to Ride the New Bull Run as Iran War Fears Fade
Data shows that spot Bitcoin ETFs are surging this month. After adding $1.3 billion in assets last month, they have now added $1.6 billion in April, which has nine more trading days to go. As such, if this trend continues, these funds may surge to $3 billion in inflows this month.
Meanwhile, futures open interest has continued to rise this week. The broader crypto market index jumped by 6% over the last 24 hours to $130 billion, up sharply from the year-to-date low of $90 billion. Bitcoin’s futures open interest has jumped to $61 billion, the highest level in months.
Bitcoin’s recovery hinges on the complete halt of the ongoing Iran war. If it ends, it means the price of crude oil will continue to fall, making it easier for the Federal Reserve to cut interest rates later this year.
BTC Price Prediction: Technical Analysis
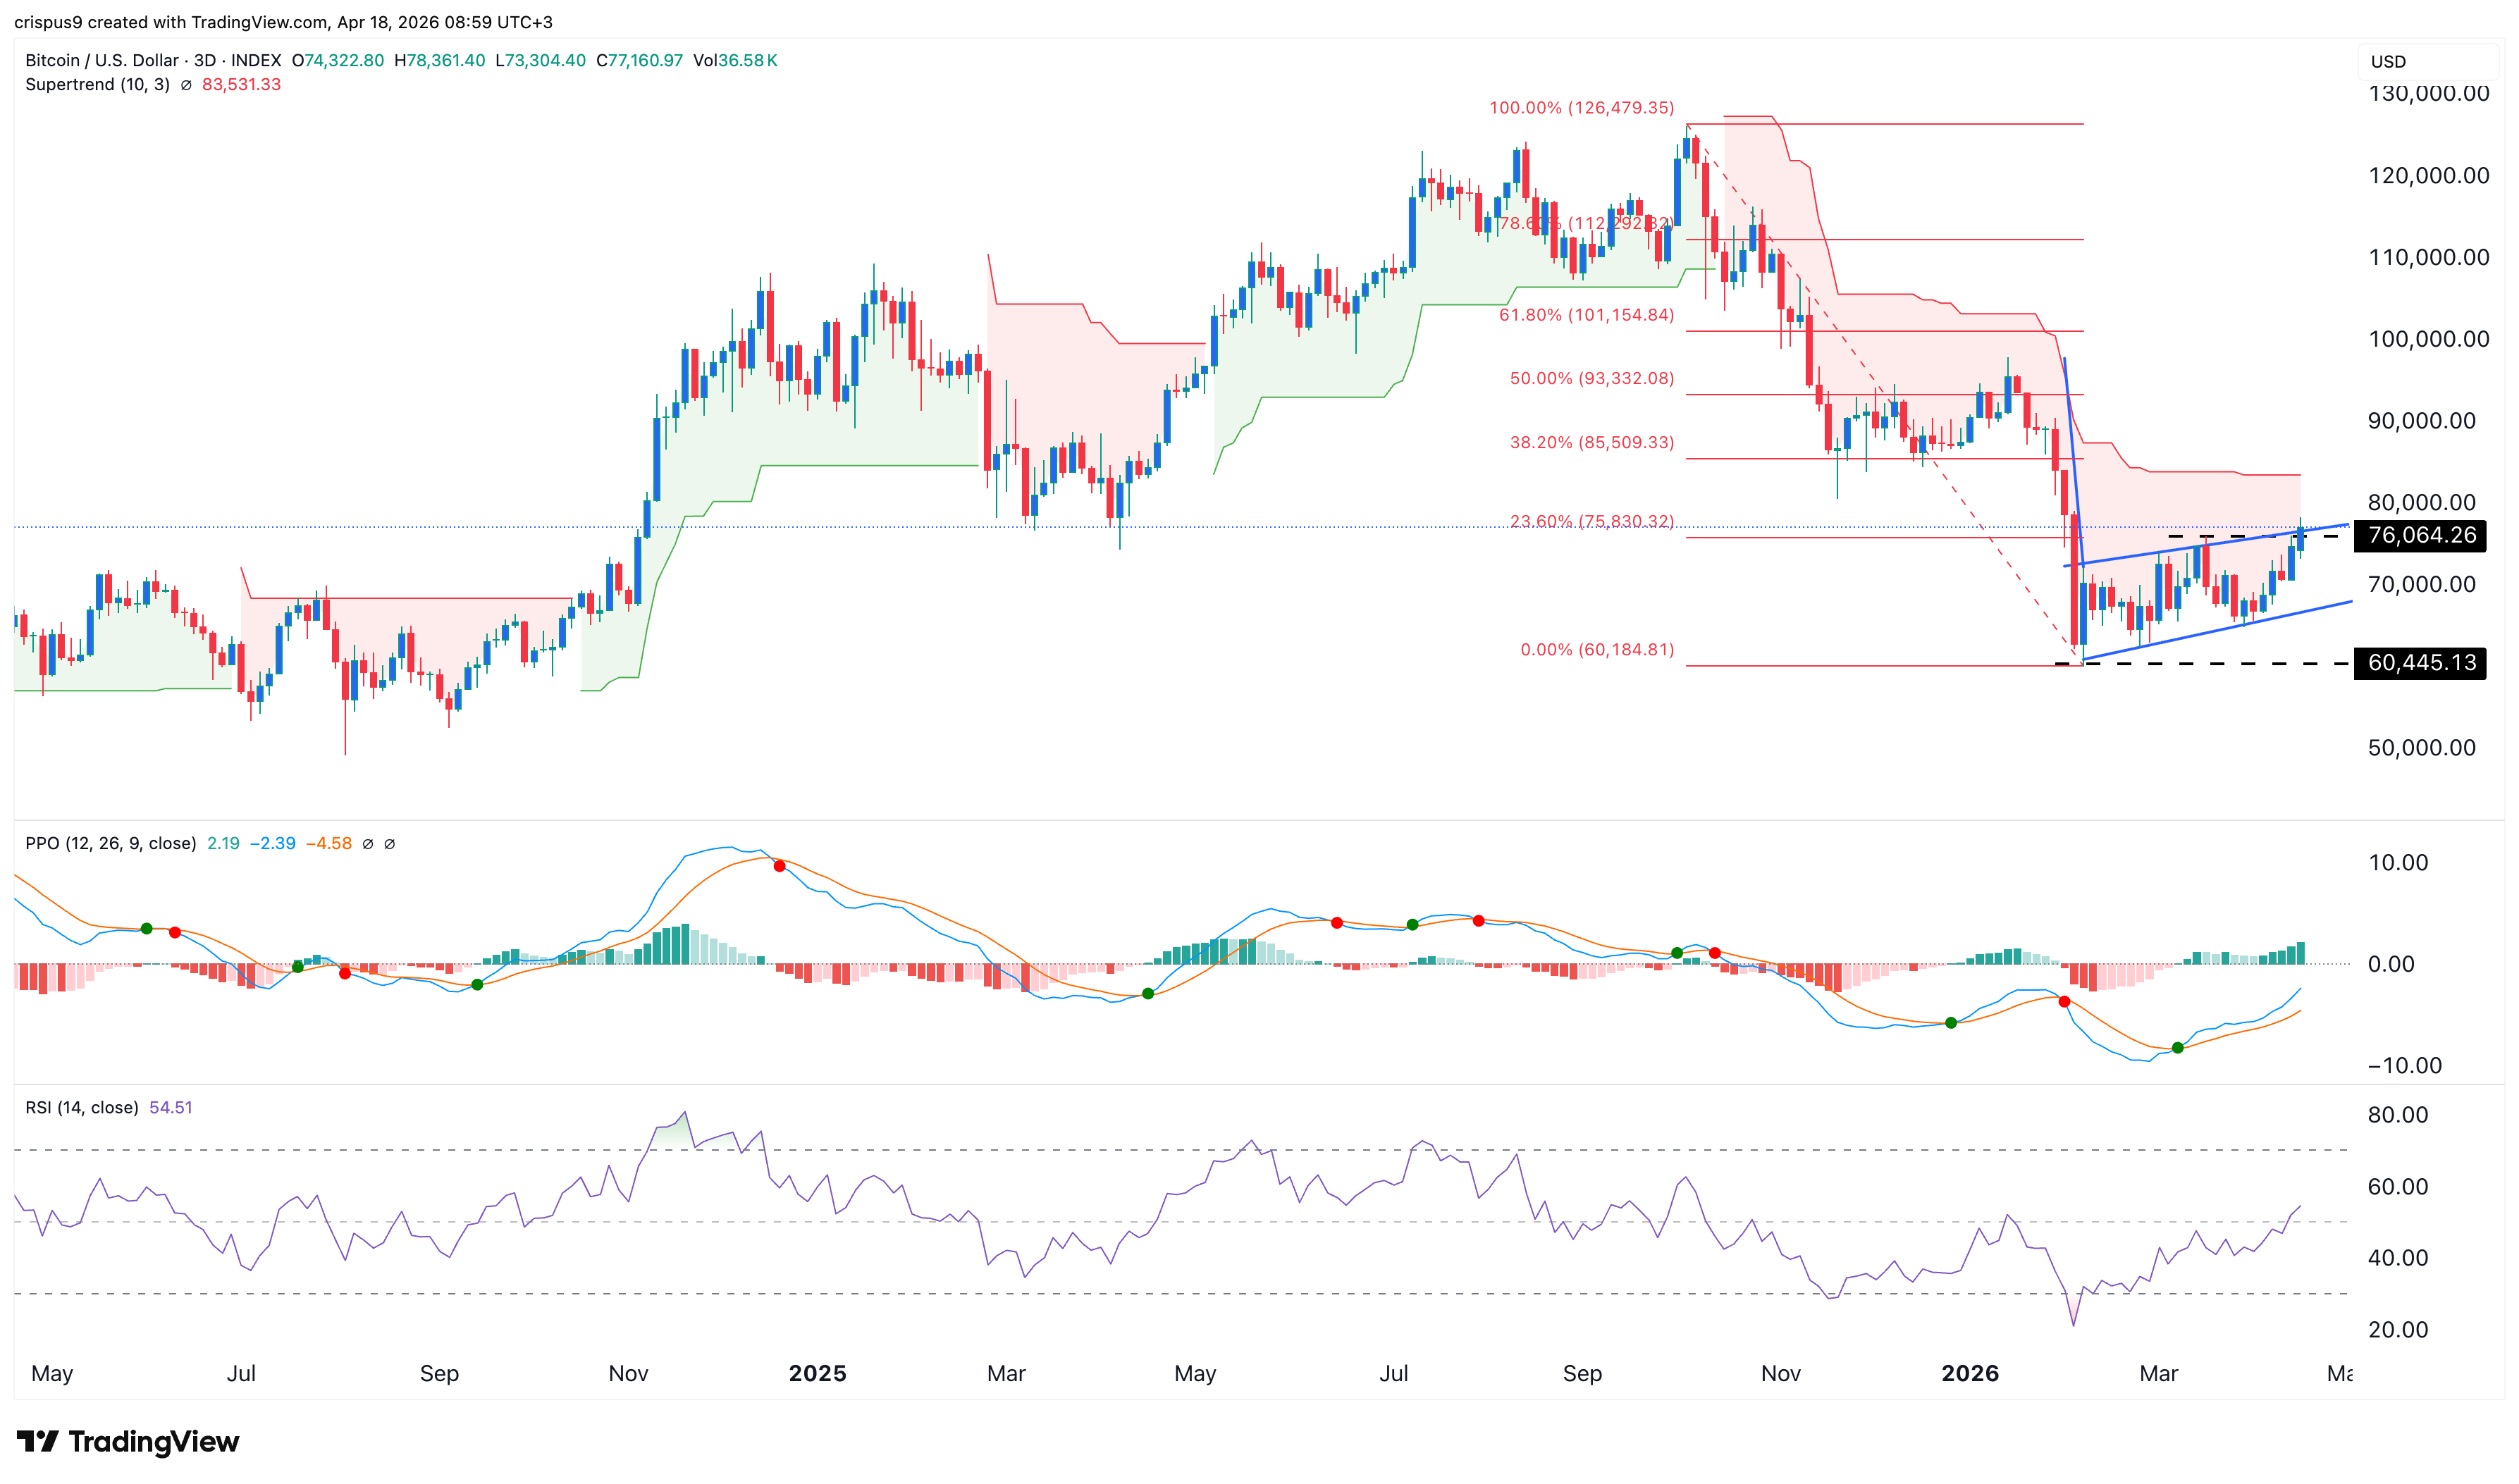
The daily timeframe chart shows that Bitcoin’s price has continued to rise as we predicted on Friday. It is now attempting to invalidate the forming bearish flag pattern, which is one of the riskiest patterns in technical analysis.
Bitcoin has also crossed the 23.6% Fibonacci Retracement level. At the same time, the Relative Strength Index (RSI) has jumped above the neutral point at 50, while the two lines of the Stochastic Oscillator have made a bullish crossover pattern.
Therefore, the most likely scenario is that the coin continues to rise in the near term, potentially to the 50% Fibonacci Retracement level at $93,300. A drop below the lower side of the flag pattern at $70,000 will invalidate the bullish outlook.
READ MORE: Nebius Stock May Soar 50% as C&H Forms Amid Relentless Growth