


- XRP price has formed a double-bottom pattern on the daily chart.
- The spread of the three lines of the Bollinger Bands has narrowed.
- Spot XRP ETF inflows have jumped by $74 million this month.
XRP price is consolidating this week, despite Bitcoin and other altcoins continuing their recovery. Ripple token was trading at $1.4320 on Thursday, a few points above the year-to-date low of $1.2636.
XRP Price Consolidates as Accumulation Signs Emerge
Data compiled by SoSoValue shows that American investors are slowly accumulating XRP tokens. Ripple’s XRP ETF inflows have jumped by $71.3 million this month, a big reversal from last month’s outflows of $31.1 million.
These inflows make this the best month for these funds since December, when they added $499 million. They have now recorded cumulative inflows of $1.2 billion and hold $1.09 billion in assets.
Bitwise, which charges a 0.37% expense ratio, has the largest assets under management at $325 million. It is followed by funds from Canary, Franklin, and 21Shares.
READ MORE: MSTR Stock Has Surged by 75%: Here’s Why and What to Expect
In most cases, ETF inflows when an asset is consolidating are normally seen as a bullish sign, as these investors believe that it will rebound over time.
A good example of this is Bitcoin, which saw $1.3 billion in inflows last month. Today, the coin has jumped to $78,000, up by over 20% from the year-to-date low.
Meanwhile, data shows that the Ripple USD (RLUSD) supply has jumped to over $1.4 billion in the last 30 days. This is a small improvement from $1.3 billion earlier this month.
Notably, however, data indicates that the adjustment volume over the last 30 days increased to over $11.6 billion, a sign that people are transacting in the coin.
Still, some key metrics are not doing well, which likely explains why the XRP price remains in a narrow range.
For example, the futures open interest and funding rate have moved in a horizontal direction. Futures open interest has stalled at $2.5 billion, down from last year’s high of $9.1 billion.
Ripple Price Technical Analysis
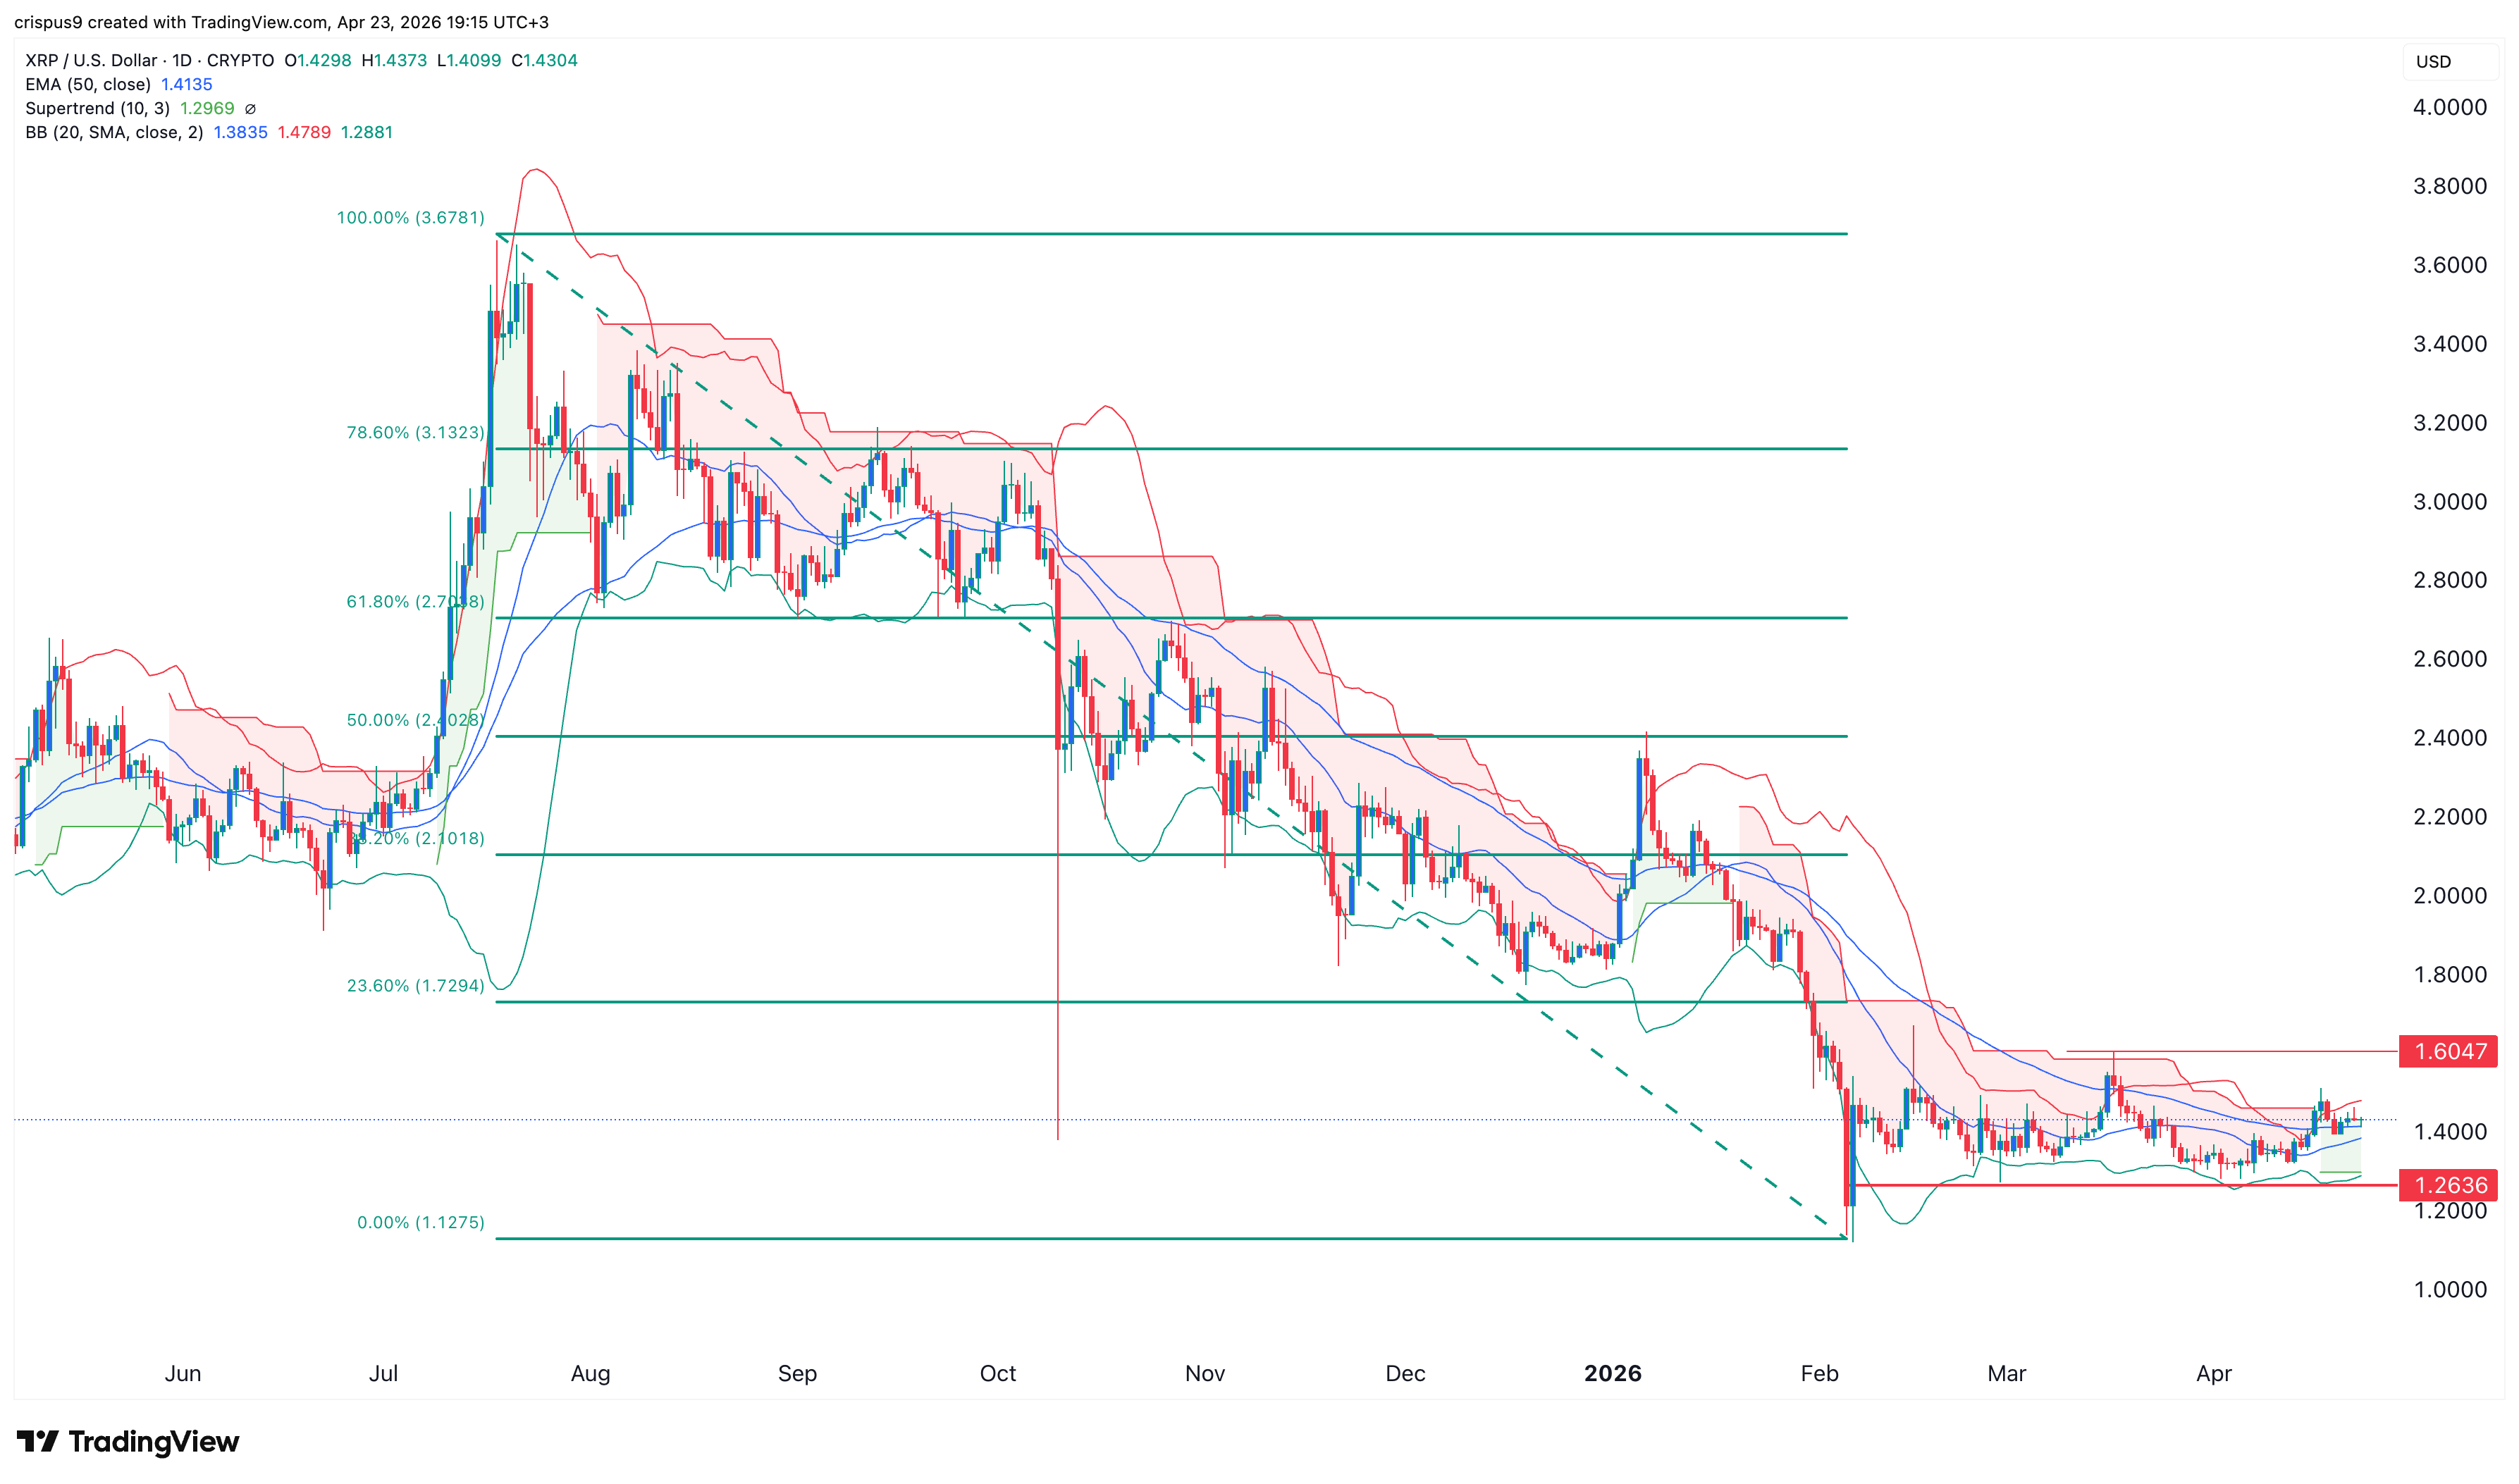
The daily timeframe chart shows that the XRP price has been moving sideways since February this year. It has remained between the key support and resistance levels at $1.2636 and $1.6047.
The coin has formed a double-bottom pattern at $1.2636 and a neckline at $1.6047. A double bottom pattern typically leads to a strong bullish breakout.
The token has also flipped the Supertrend indicator from red to green and is attempting to move above the 50-day Exponential Moving Average (EMA).
Also, the spread between the three lines of the Bollinger Bands has narrowed substantially in the past few months. This situation normally leads to a strong bullish breakout.
If this happens, the next key level to watch is $1.6047. A move above that price will lead to more gains to the 23.6% Fibonacci retracement level at $1.7420. Crossing that price will lead to gains toward a psychologically critical $2 level.
READ MORE: Crypto Market Rally Today: Reasons Why BTC and Altcoins are Rising