


- Bitcoin price jumped and stalled at $80,000 this week.
- Spot Bitcoin ETF inflows lost the momentum in the last two days.
- It has formed an ascending triangle pattern, pointing to more gains.
Bitcoin price has stalled at $80,000 as investors watch the ongoing tensions between the US and Iran. It also wavered as the spot Bitcoin ETF inflows lost momentum. BTC coin was trading at $80,400, up sharply from the year-to-date low of $60,000.
Spot Bitcoin ETFs Have Lost Momentum
Bitcoin ETFs started the month with a bang as they added over $1.6 billion in inflows in the first four days. This was a big jump as the funds added $1.9 billion in April. As a result, had the trend continued, the funds would have crossed the April haul this week.
Data shows that the momentum faded in the last two days. They had over $145 million in outflows on Friday after losing $277 million a day earlier. Most of the outflows on Friday came from Fidelity’s FBTC followed by BlackRock’s IBIT and ARK’s ARKB.
READ MORE: IREN Stock Price Rare Pattern Points to a Surge to $93 After the NVIDIA Deal
The ongoing outflows are likely because of the flaring tensions between the US and Iran. As you recall, the week started with optimism that the two countries would reach an agreement within days. An Axios report said that the one-page document would be inked soon.
The week ended with pessimism as the US continued to hit some Iranian targets. It fired at some tankers in the Iranian coast as it continued to implement its blockade. Therefore, there is a possibility that another round of war will start soon.
Bitcoin price also wavered after the US published another strong jobs report. This report revealed that the economy added 115k jobs in April this year, after adding 185k jobs in the previous month. The unemployment rate remained unchanged at 4.3%.
These numbers mean that the Federal Reserve will not have the urgency to cut interest rates this year. Besides, inflation is expected to remain at an elevated level this year because of the ongoing war in Iran that has pushed energy prices higher. The next key catalyst to watch will be the upcoming US inflation report next week. Analysts expect the data to show that inflation jumped to 3.6% in April.
Bitcoin Price Prediction: Technical Analysis
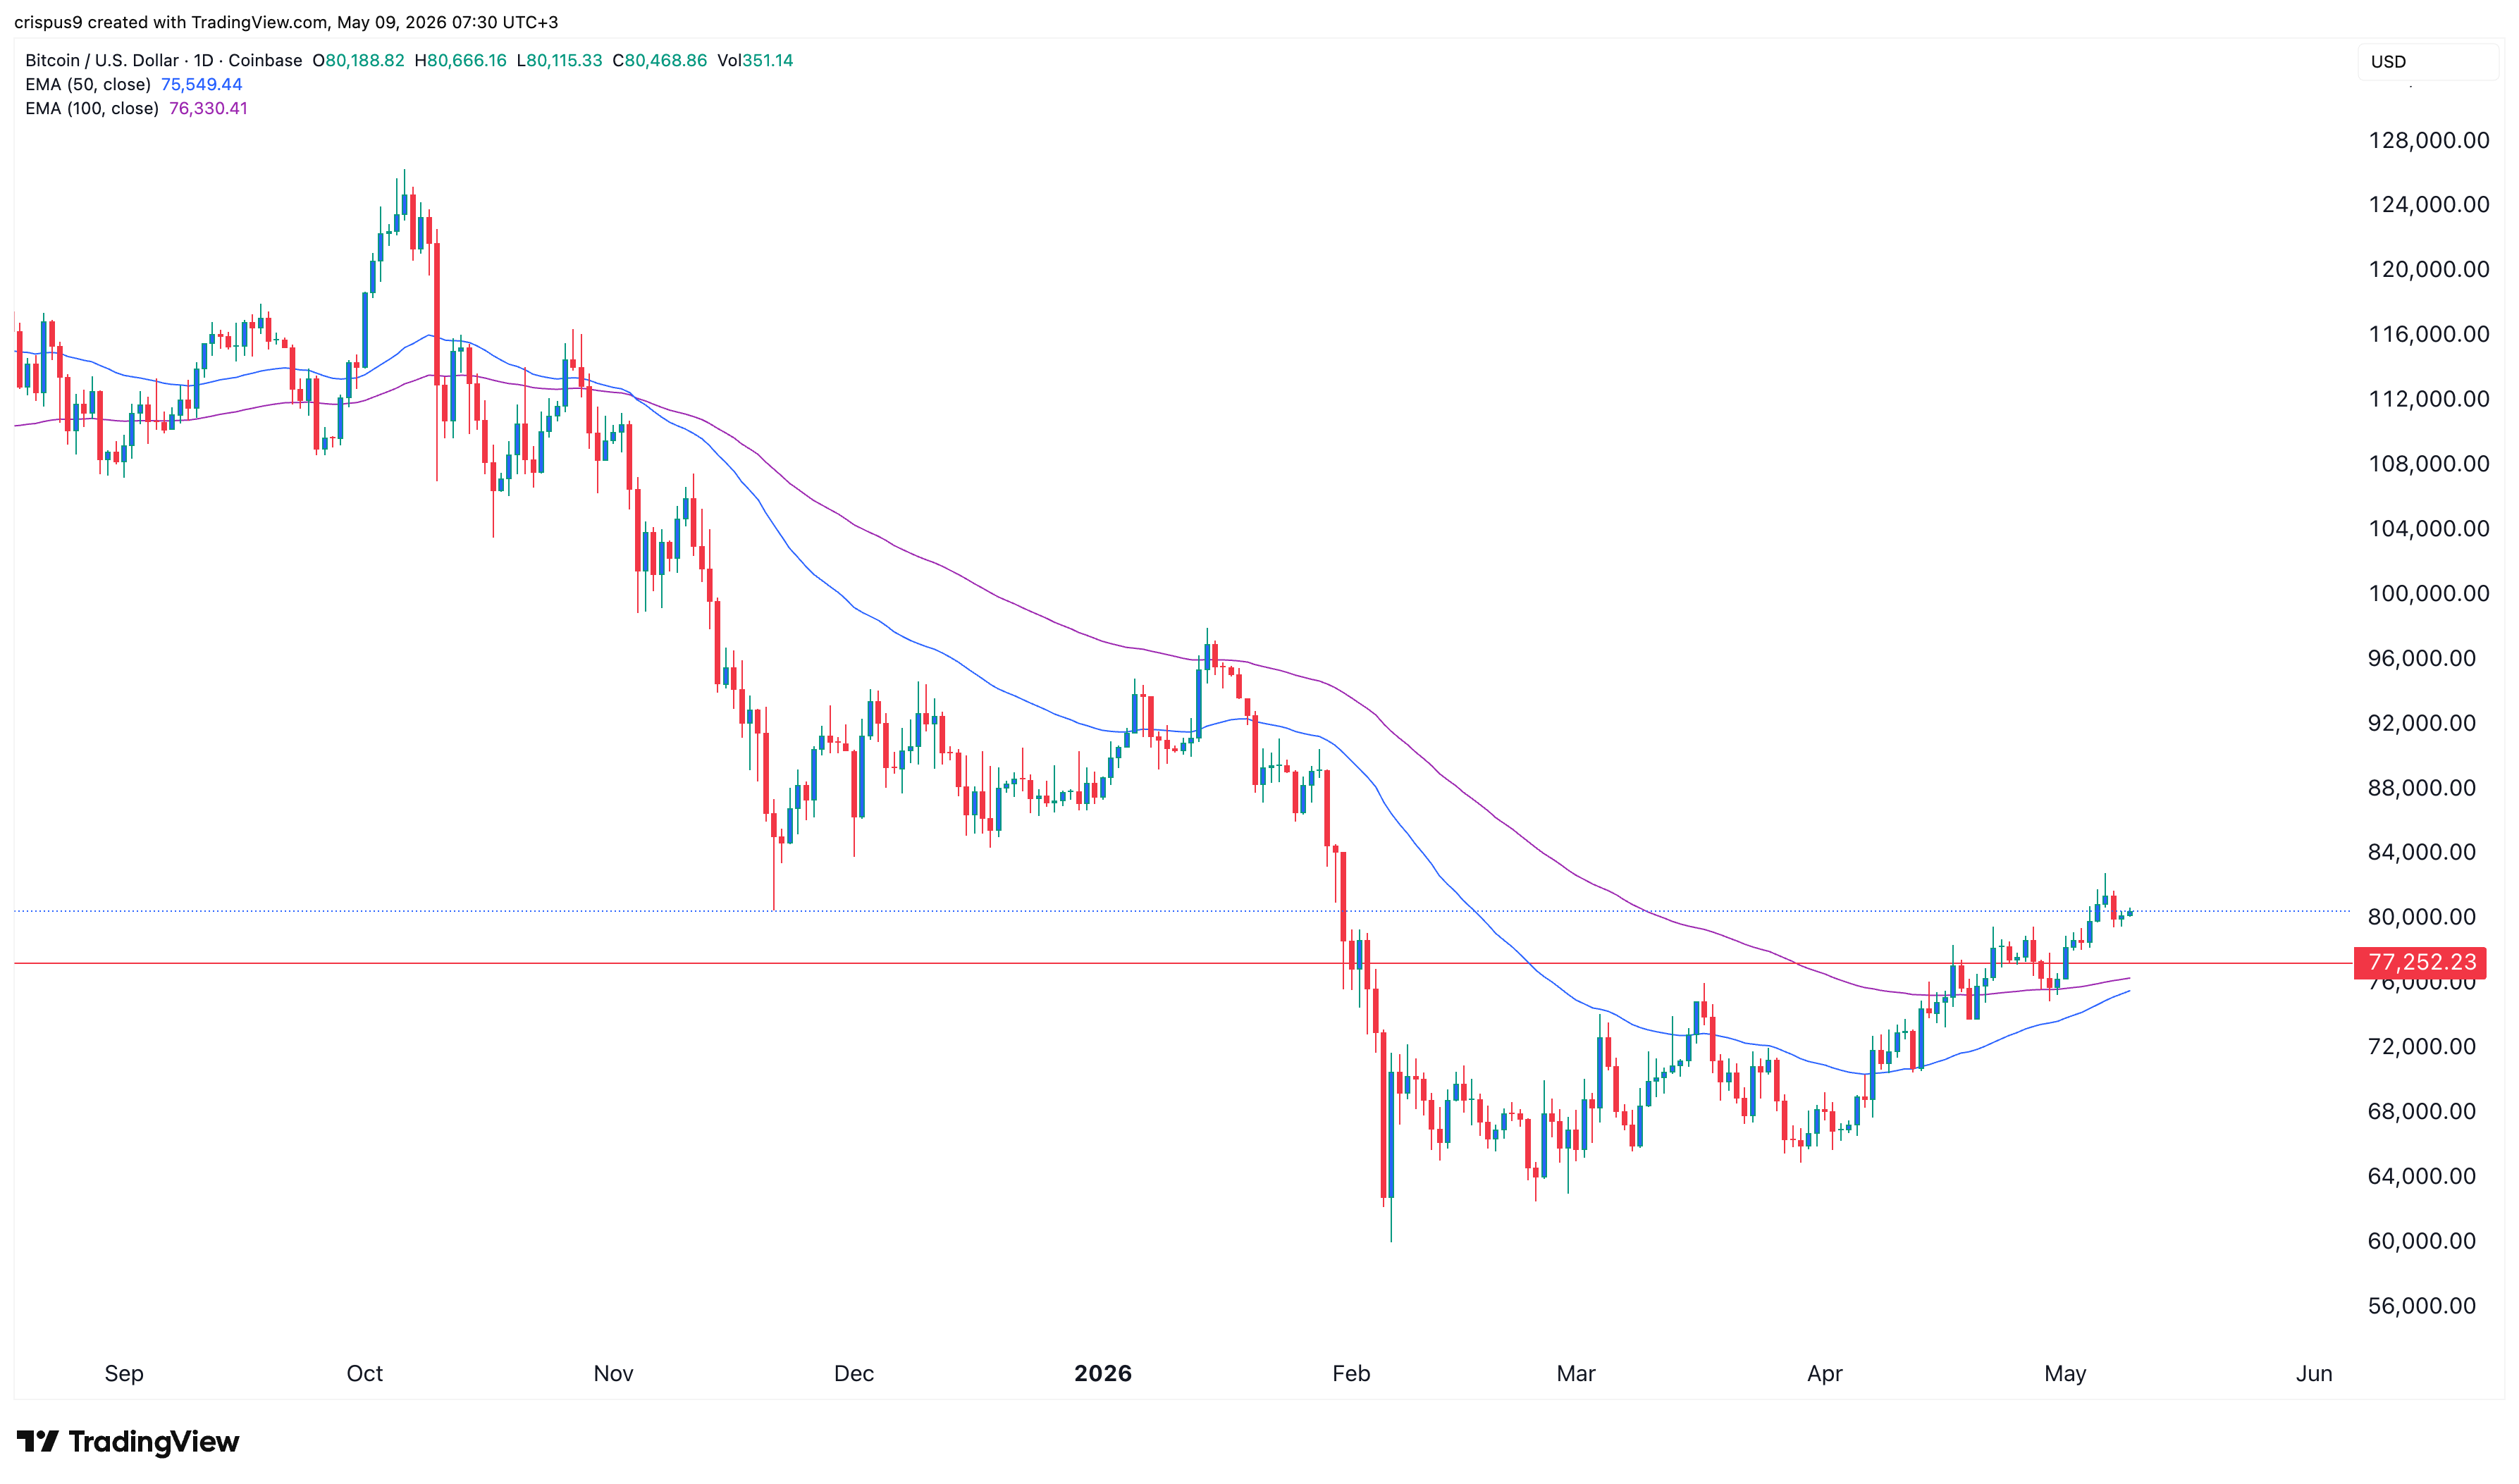
BTC price chart | Source: TradingView
The daily timeframe chart reveals that the BTC price has rebounded this year, moving from a low of $60,000 to $80,400 today. It has already crossed the important resistance level at $77,450, the upper side of the ascending triangle pattern.
The coin has jumped above the 50-day and 100-day Exponential Moving Average (EMA), which is a bullish sign. It has also moved above the Supertrend and Ichimoku cloud indicators. Also, the Average Directional Index (ADX) has moved to 30 and pointing upwards, a sign that the momentum is growing.
Therefore, the coin will likely continue rising, with the next key target to watch being at $90,000. A surge above that price will point to more gains, potentially to $100,000.
READ MORE: Circle Stock Price Double-Bottoms: Will it Surge After Monday’s Earnings?