


Bitcoin price has remained stable in the past few weeks. BTC was trading at $81,500 on Tuesday, inside a narrow range it has remained in the past few weeks. It could be at risk of a bearish breakout in the near term after hitting the 200-day moving average, and as the risky rising wedge pattern forms.
Ray Dalio Blasts Bitcoin Role as a Safe Haven Asset
Billionaire Ray Dalio has blasted Bitcoin’s role as a safe-haven asset. In an X post, he argued that Bitcoin lacked privacy features as transactions are public and can be monitored. Additionally, he noted that Bitcoin was relatively correlated with technology stocks, which are viewed as risky assets.
Dalio also believes that Bitcoin is a fairly small and controllable market. Instead, he believes that gold stands alone as there is only one gold. It is also a crucial part of the global economy, especially as central banks continue to accumulate.
However, a closer look at the evidence suggests that Dalio’s argument is not all that accurate. For example, his claim that Bitcoin is correlated with technology stocks is incorrect. For one, the Nasdaq 100 Index has soared to a record high even as Bitcoin remains in a bear market.
READ MORE: Here’s Why the Jasmy Coin Price is Soaring and Why it May Rally 40%
Also, data shows that spot Bitcoin ETFs have added over $5 billion in the last three months. Popular gold ETFs like GLD and IAU have all shed millions of dollars in assets. Also, Bitcoin price has jumped by over 21% since the war started, while gold has dropped by over 10% in the same period.
Looking ahead, the next important catalyst for the Bitcoin price will be the upcoming US consumer inflation report. Economists expect the upcoming report to show that the headline CPI rose to 3.6% in April. Such a move would push the Federal Reserve to embrace a more hawkish tone.
Bitcoin Price Prediction: Technical Analysis
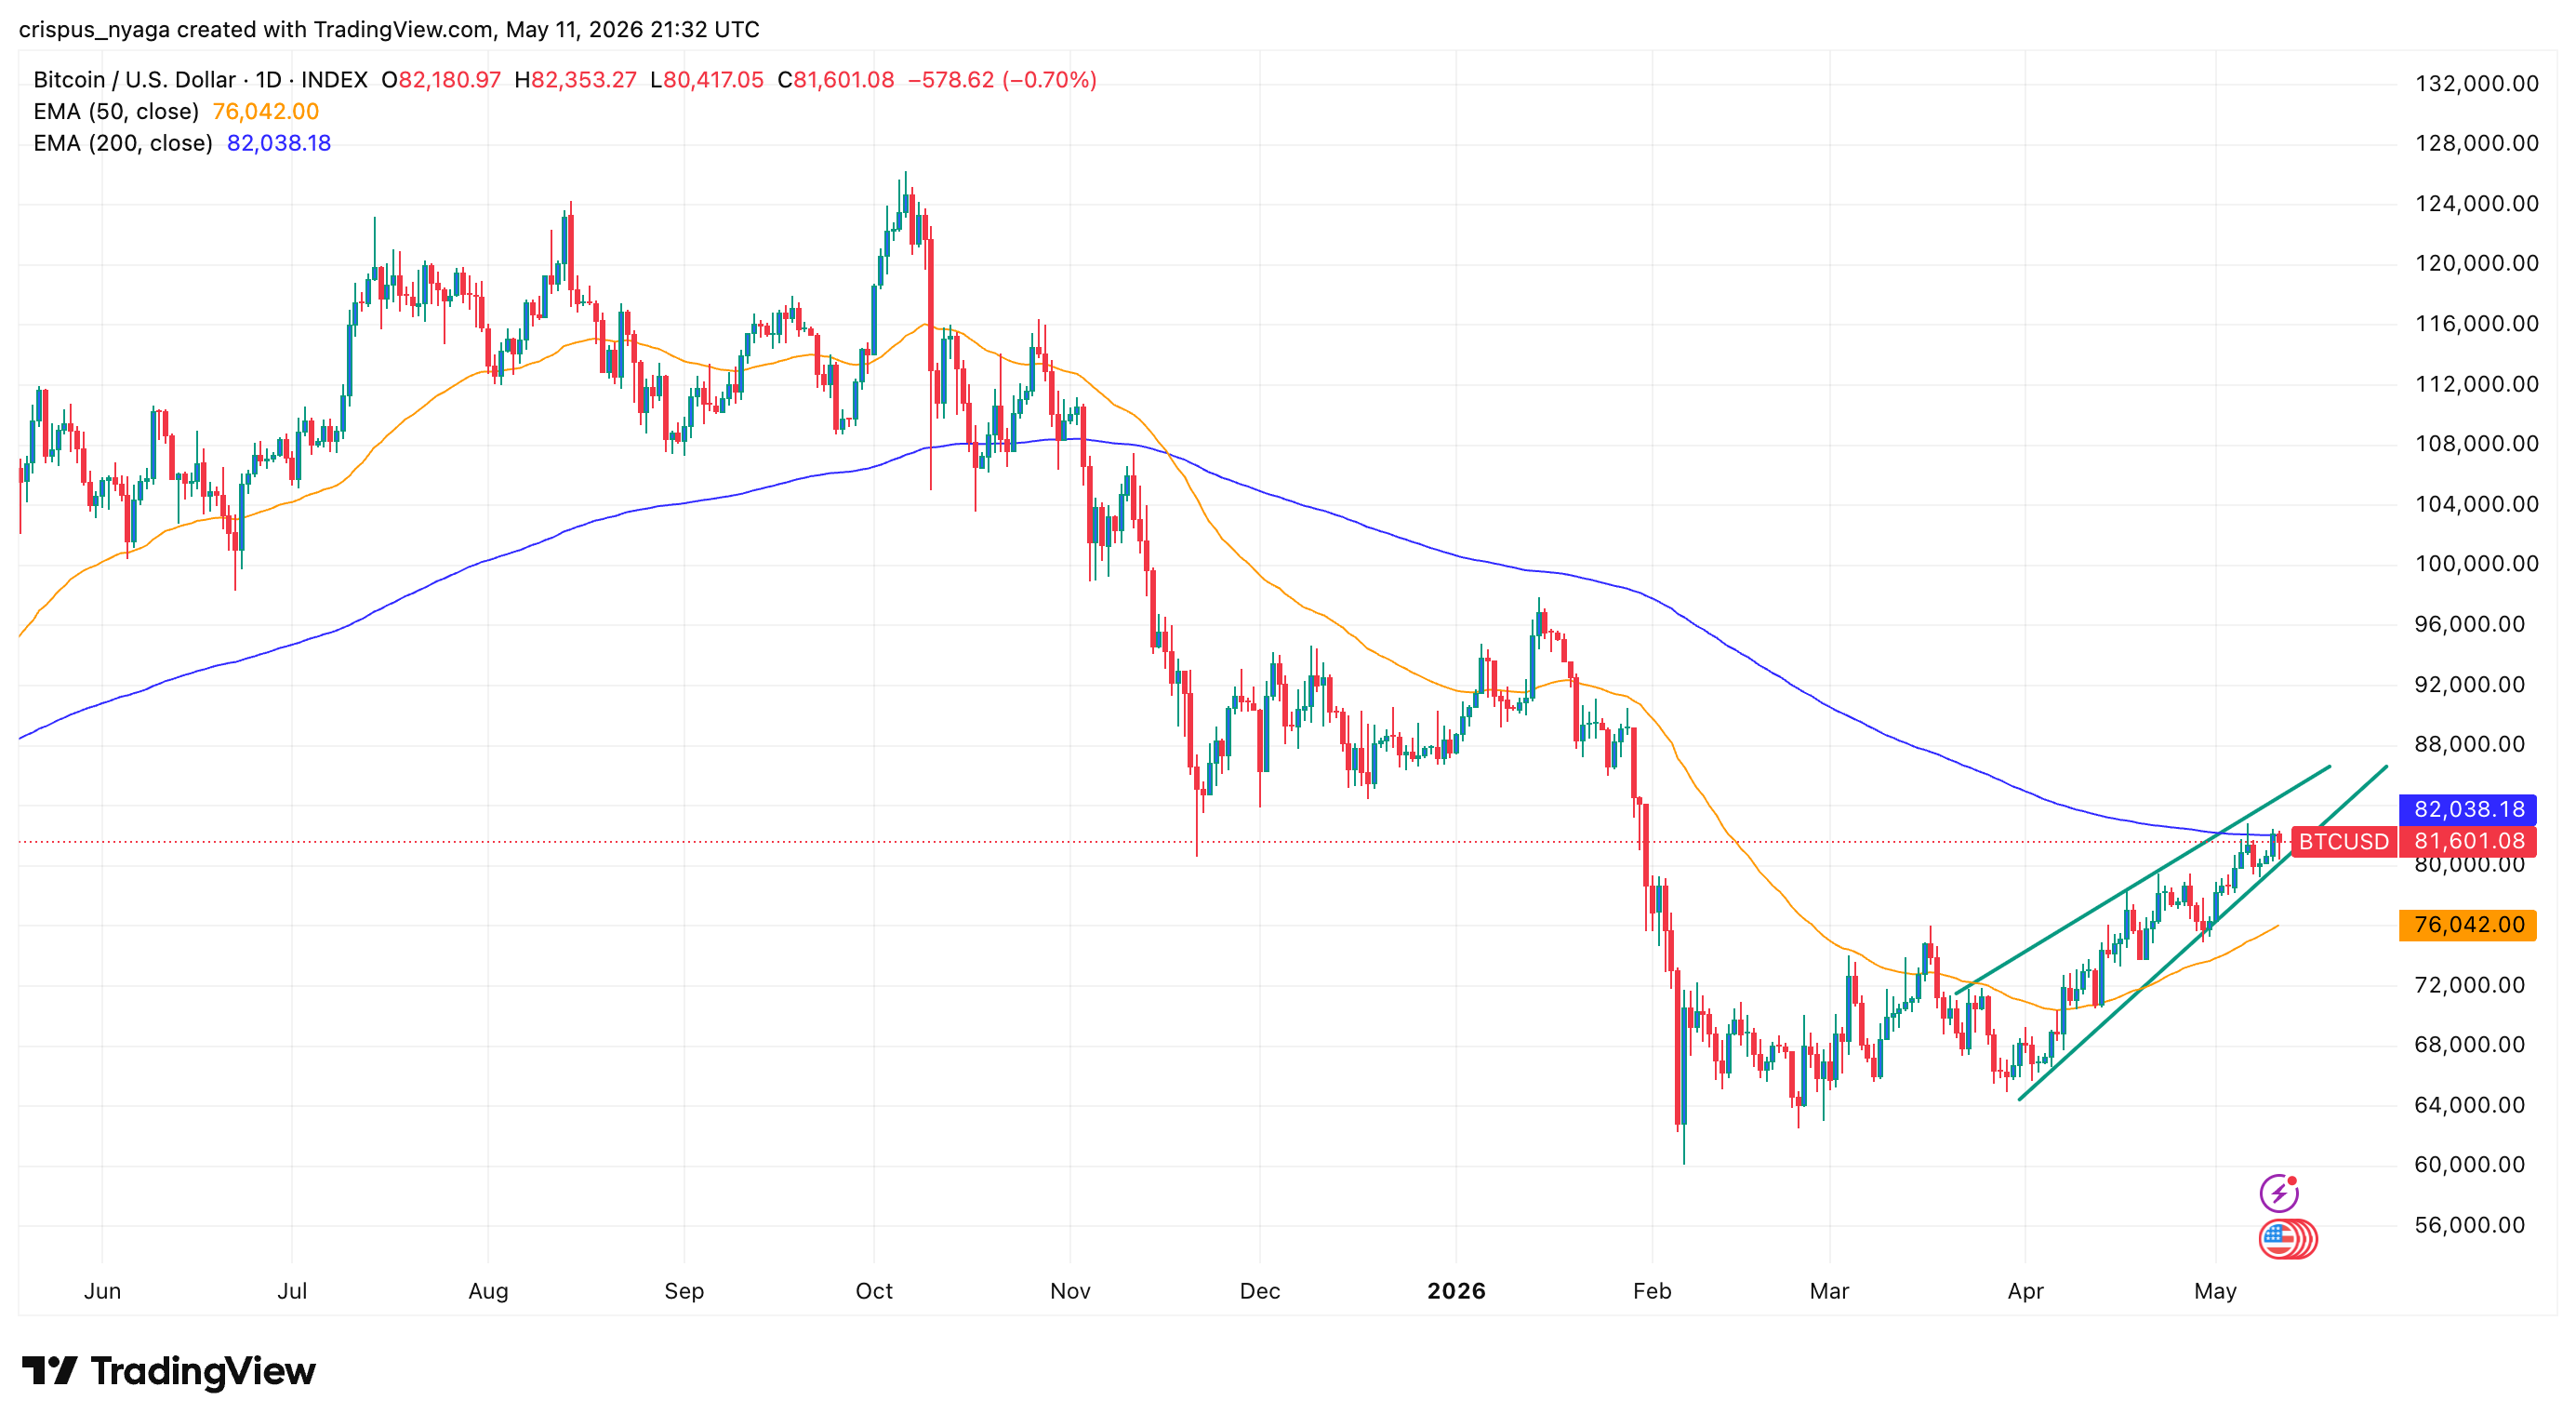
The daily chart shows that the BTC price has struggled to break above the key $82,000 resistance level. It has also failed to move above the 200-day moving average.
At the same time, the coin has formed a rising wedge chart pattern, with its two lines about to converge. This pattern often points to more downside in the near term.
Therefore, there is a likelihood that the coin will break down in the near term. If this happens, the next key level to watch is $75,000. On the flip side, a move above the key $85,000 resistance will invalidate the bearish outlook.
READ MORE: Nebius Stock Price Forecast Ahead of Earnings: Buy, Sell, or Hold?