


- Bitcoin price retreated to $78,900 on Saturday.
- Spot Bitcoin ETFs shed over $1 billion in assets this week.
- BTC has formed a rising wedge pattern, pointing to more downside.
Bitcoin price retreated for two consecutive days, reaching its lowest level since May 4 as BTC ETF outflows accelerated. BTC was trading at $78,900, down from this month’s high of $82,847. It has also formed some major risky patterns, pointing to more downside in the near term.
Bitcoin Price Falls as ETFs Suffer a $1 Billion Meltdown
Data shows that investors have continued dumping their Bitcoin tokens this week. They dumped tokens worth over $290 million on Friday, bringing their weekly outflows to $1 billion. After adding $1.8 billion in the first few days of the month, these funds have now had a cumulative net inflow of $252 million.
BlackRock’s IBIT ETF shed over $136 million in assets on Friday, while Fidelity’s FBTC and Grayscale’s GBTC lost over $39 million and $43 million in assets, respectively. The other top losers were funds by companies like Bitwise, Ark, and Franklin Templeton.
Bitcoin ETFs have suffered outflows amid the rising concerns about the American economy, as inflation jumped. The headline Consumer Price Index (CPI) jumped to 3.8% in April, moving further from the Fed’s target of 2.0%. Core inflation jumped to 2.6%, while the Producer Price Index (PPI) soared to 6.0%.
READ MORE: Top 4 Risks That May Derail the Crypto Market Rally
These numbers suggest that the Federal Reserve will maintain a hawkish tone this year. A Polymarket poll suggests that the bank will not hike rates this year. In a recent note, Morgan Stanley analysts predicted that the bank will maintain rates unchanged this year and hike in October next year.
There are also signs that investors have embraced a risk-off sentiment. For example, the Crypto Fear and Greed Index has dropped from the year-to-date high of 60 to the current 45. It has continued pointing downwards this month.
Bitcoin Price Prediction: Technical Analysis
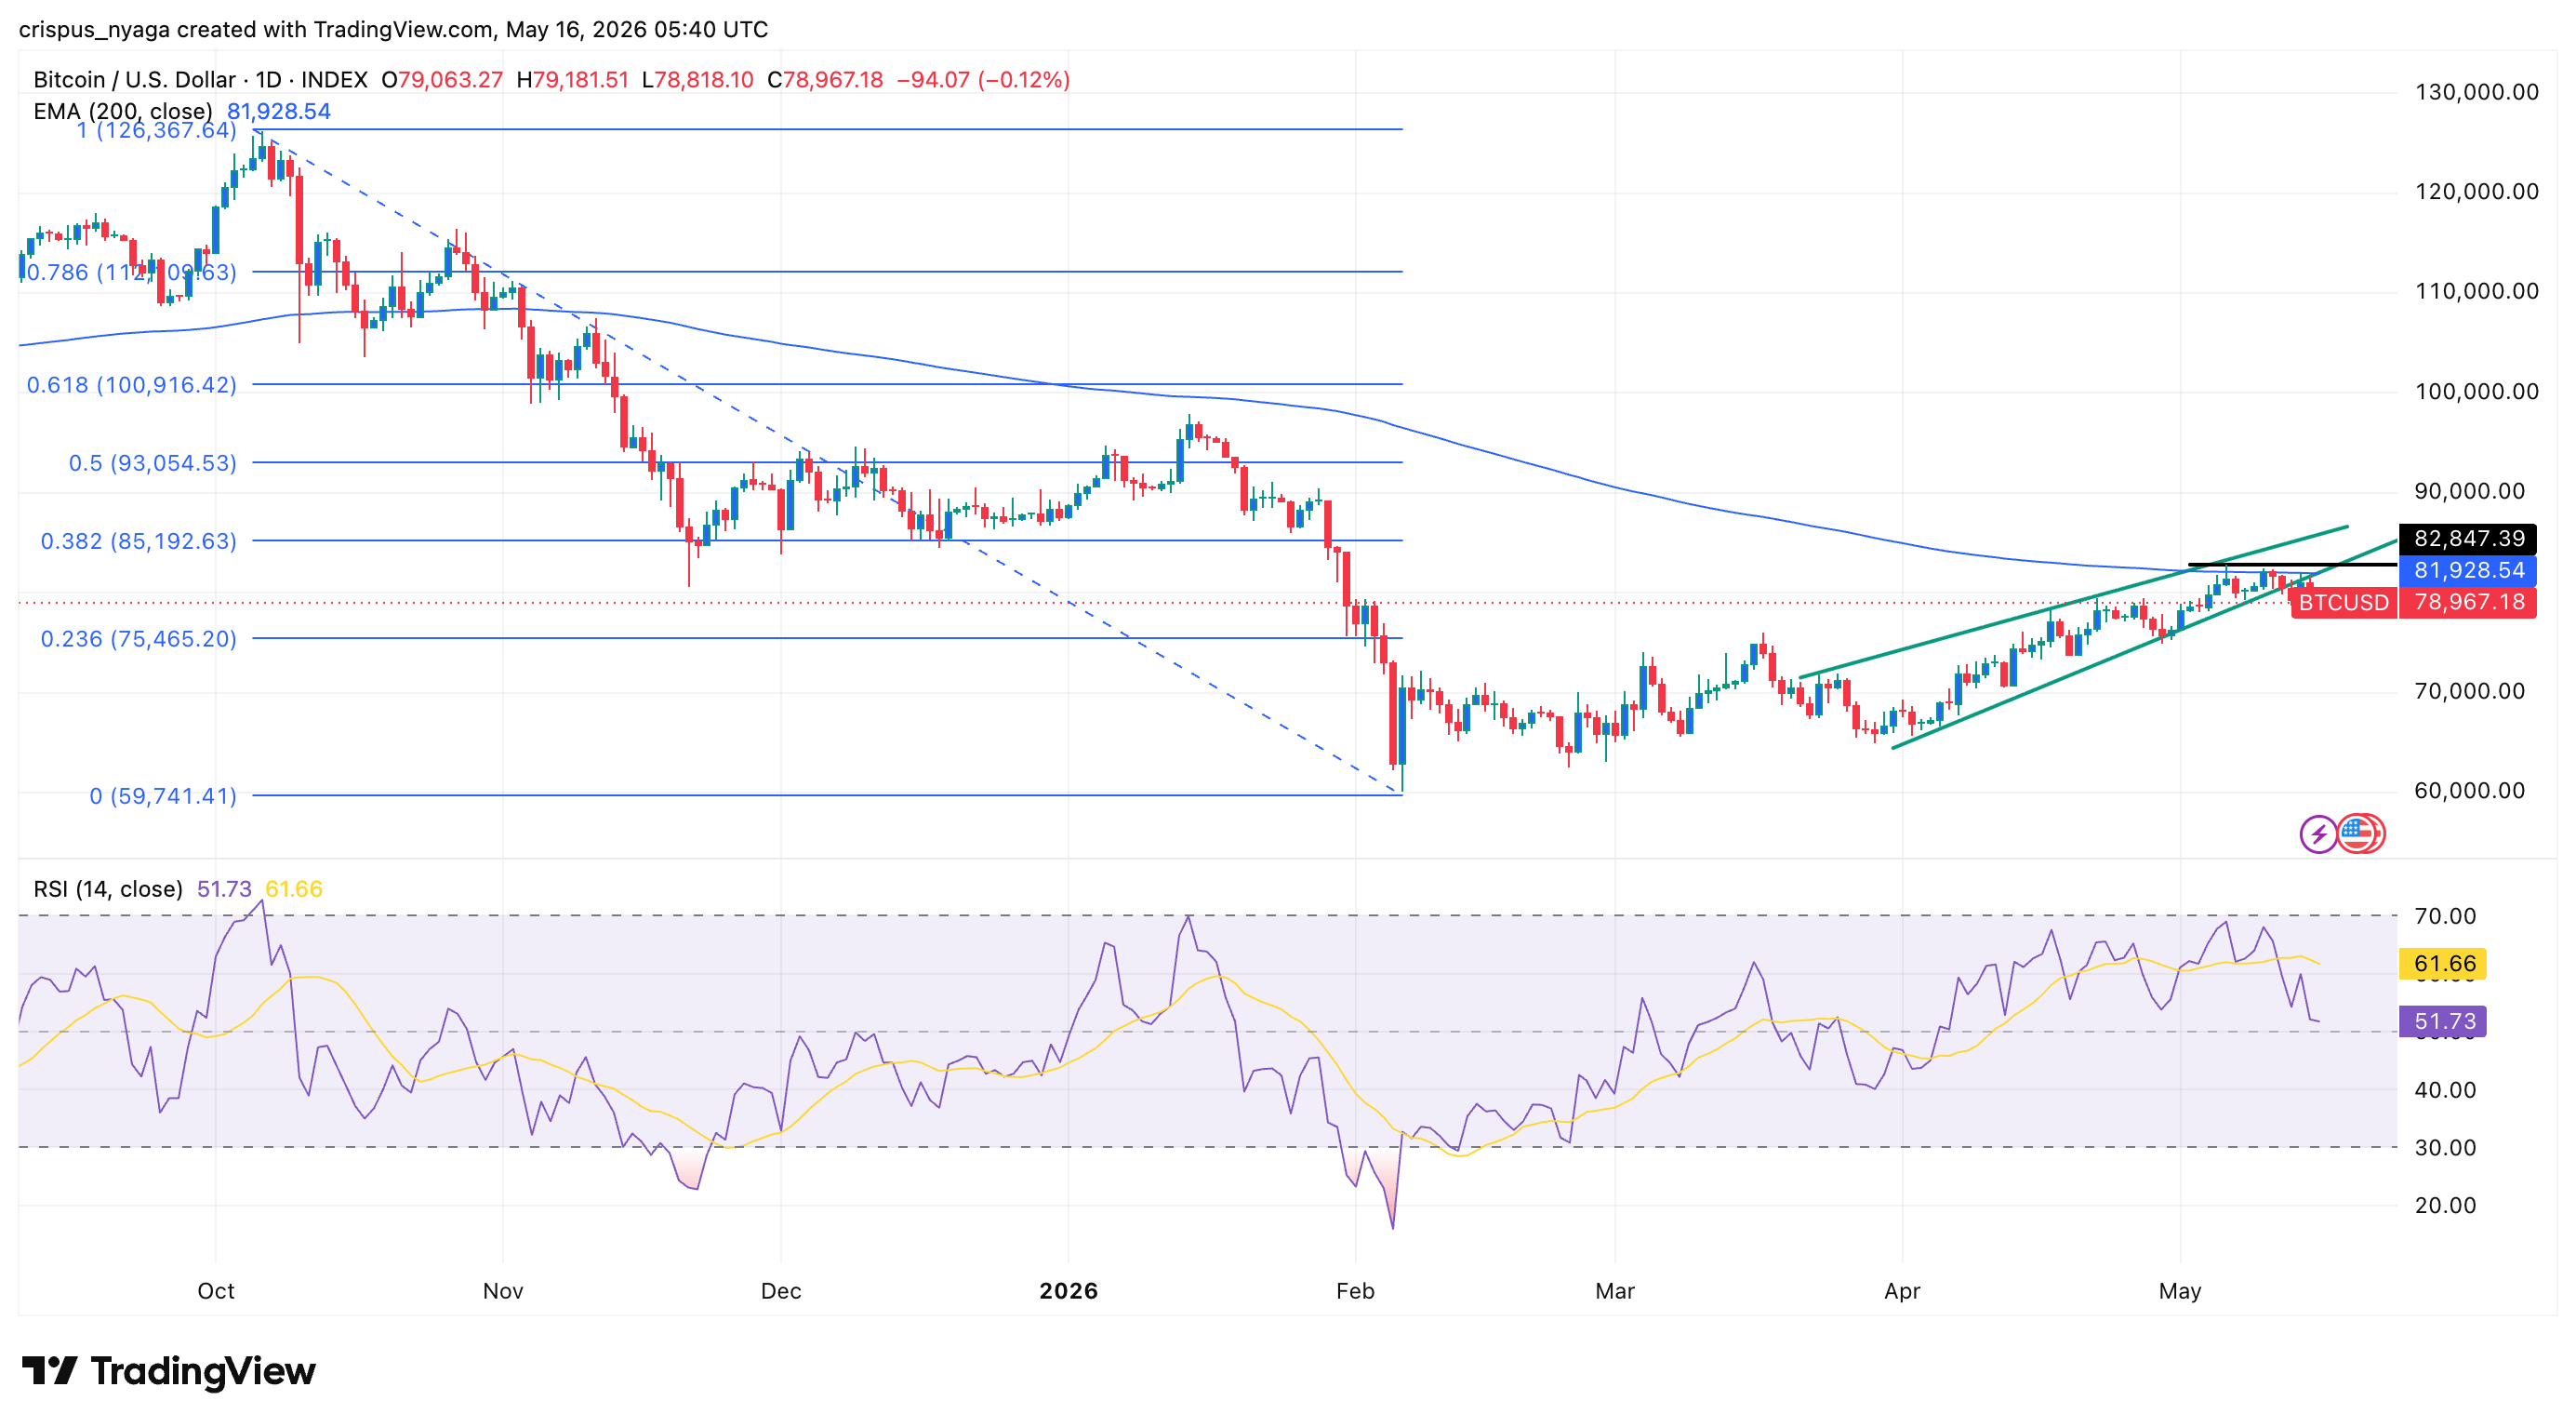
Technicals suggest that the BTC price has pulled back over the past few days, moving from a high of $82,847 to the current $78,980. It faced substantial resistance at the 200-day Exponential Moving Average (EMA).
The coin formed a rising wedge pattern, characterized by two rising, converging trendlines. It has already plunged below the lower side of this pattern, confirming the bearish outlook.
Bitcoin formed a bearish divergence pattern, while the Relative Strength Index (RSI) has been trending downward. It is about to cross the neutral point at 50.
Therefore, the coin will likely continue falling, potentially to the crucial support level at $70,000. On the other hand, a move above the key resistance at $82,847 will invalidate the bearish outlook and point to more upside, potentially to $100,000.
READ MORE: Top 4 AI Crypto Coins to Buy Ahead of NVIDIA Earnings on May 20