


Crypto prices were relatively mixed today, May 20th, with some popular names like Zcash (ZEC), Ondo Finance (ONDO), and Hyperliquid (HYPE) continuing their recent rally. Others, however, like Ripple (XRP) and Pi Network (PI) remained under intense pressure.
Zcash Price Prediction
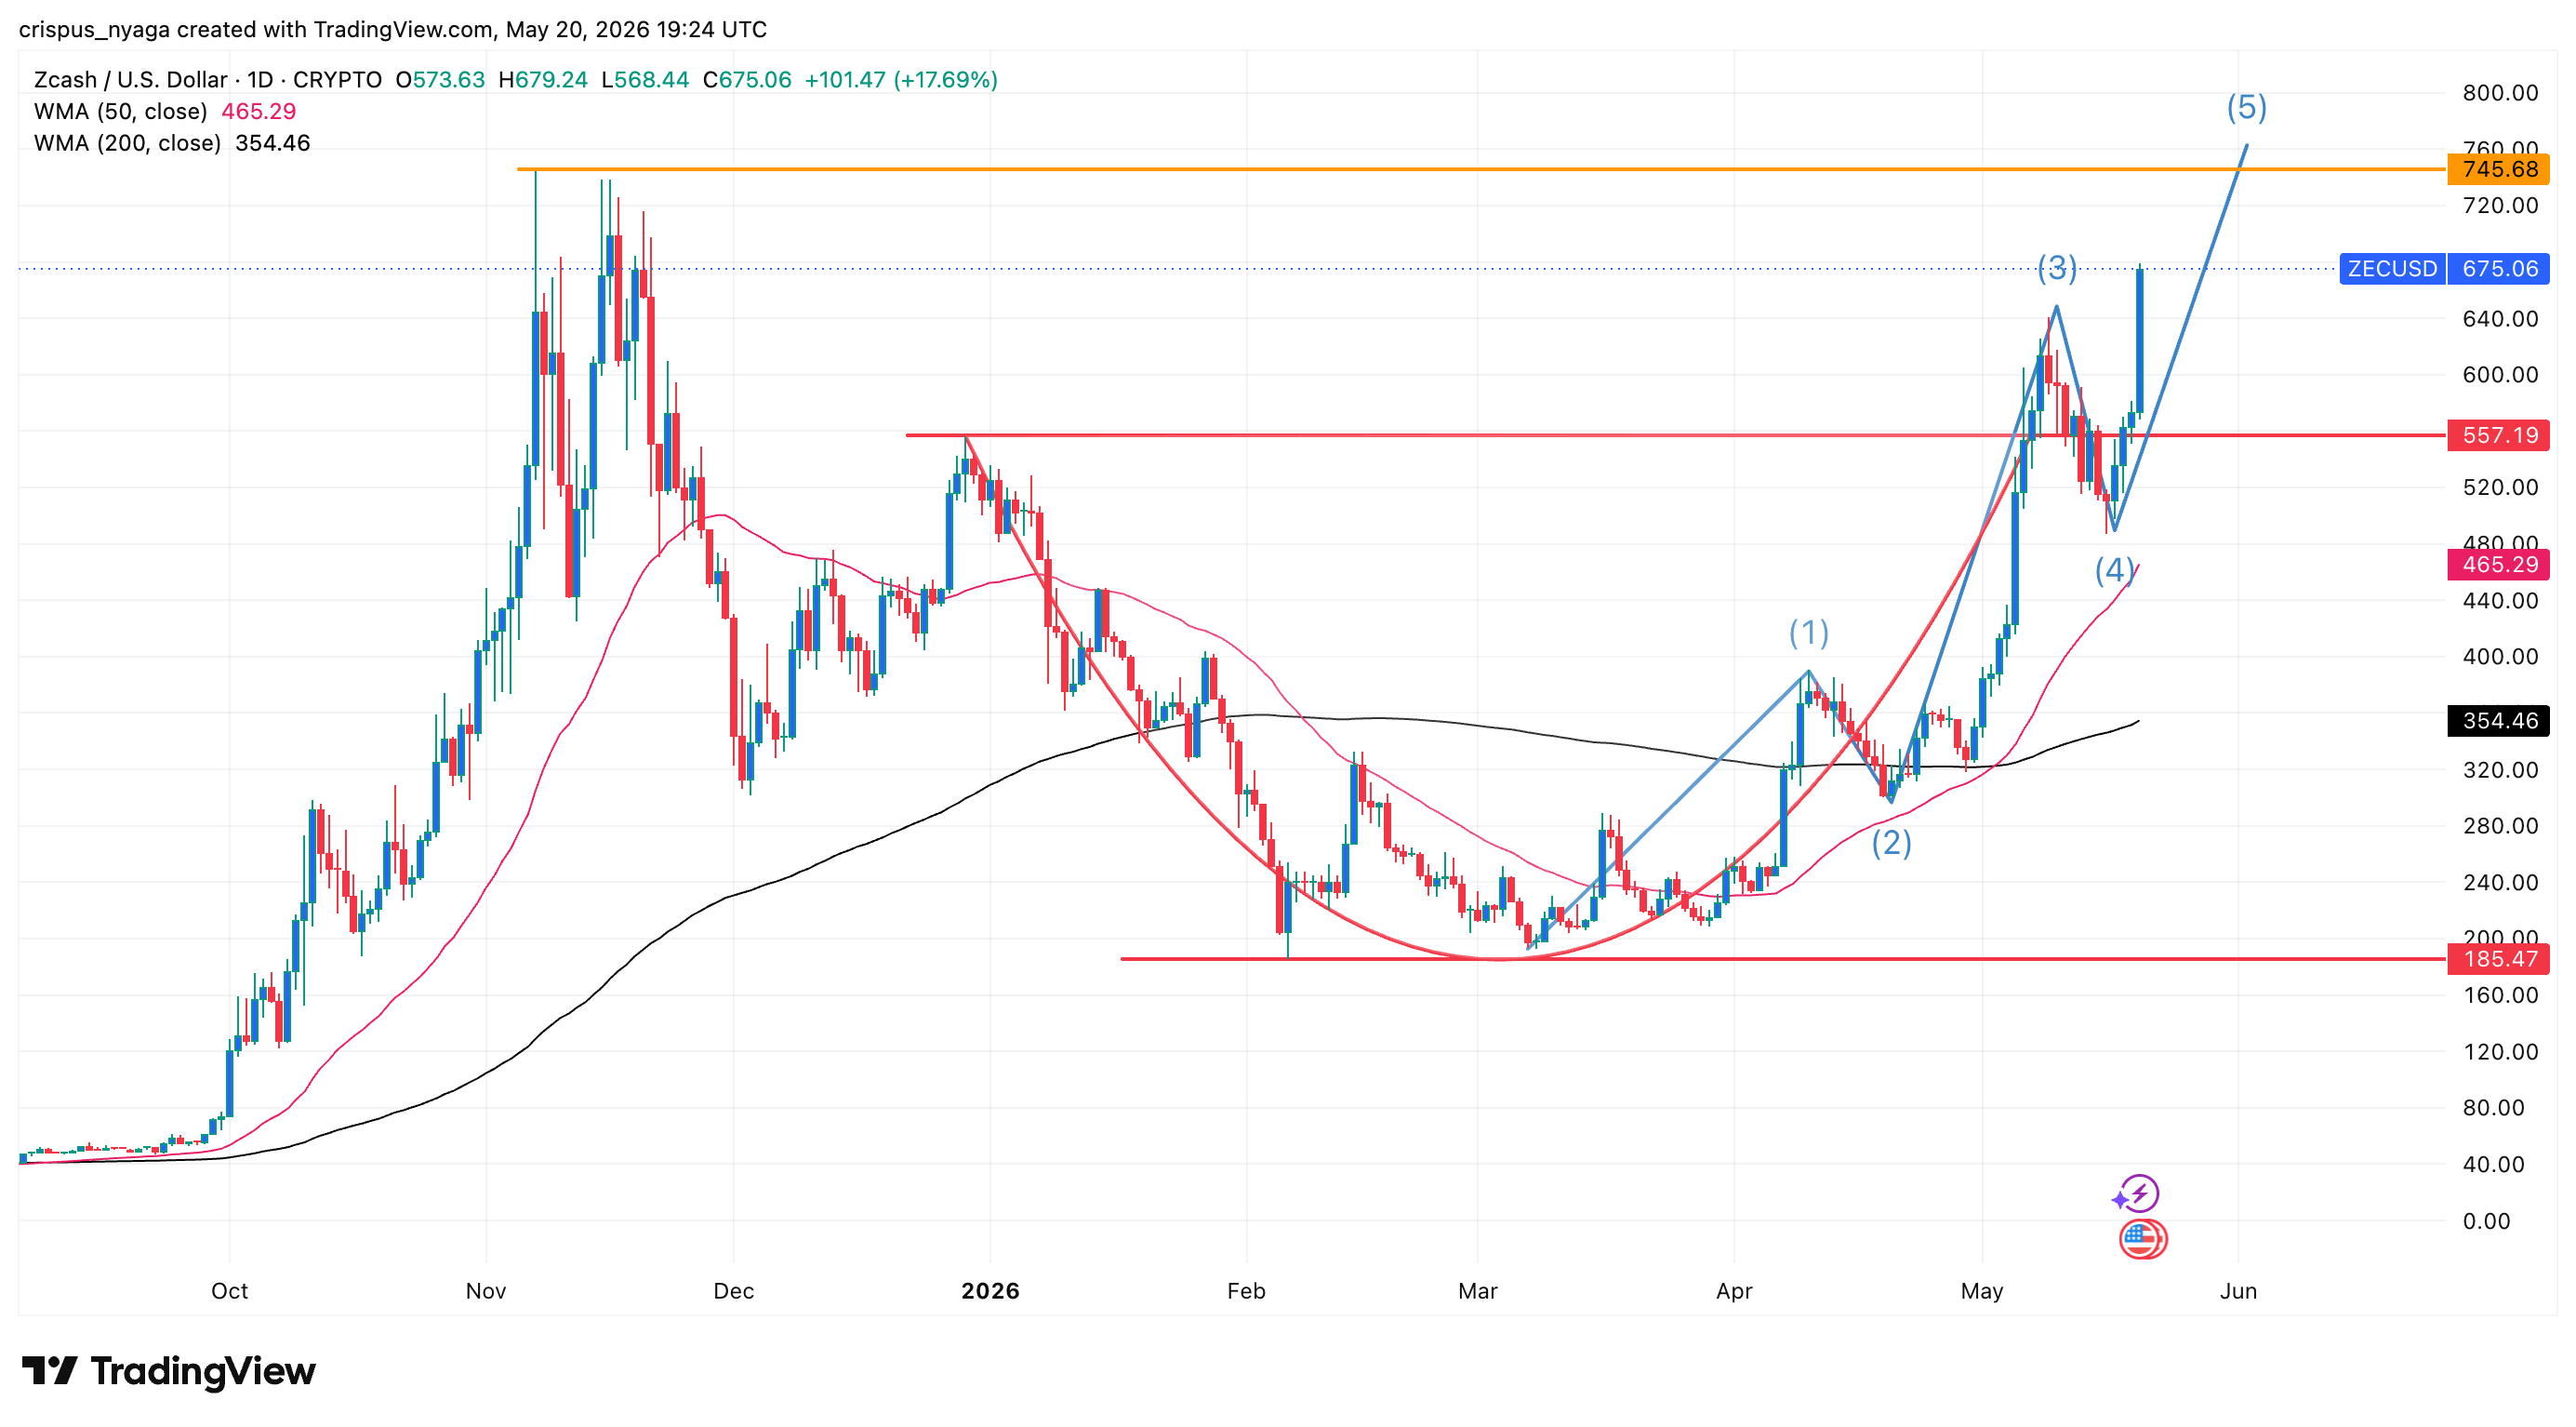
ZEC price has rebounded in the past few months, soaring from a low of $185 to the current $655. This rally coincided with the ongoing demand for privacy tokens and the Winklevoss Twins’ buying.
The daily chart shows that the coin formed a cup-and-handle pattern, a common bullish continuation sign in technical analysis. It recently completed the formation of the handle section and has now made a bullish breakout.
The coin has also moved to the final stage of the impulse phase of the Elliot Wave pattern. This stage is usually highly bullish. Therefore, the most likely Zcash price prediction is bullish, with the next key target being last year’s high of $745. A move above that level will point to more gains, potentially to $1,000.
READ MORE: HIVE Digital Stock Eyes a 45% Surge Despite Risks to Its AI Pivot
Ondo Price Prediction
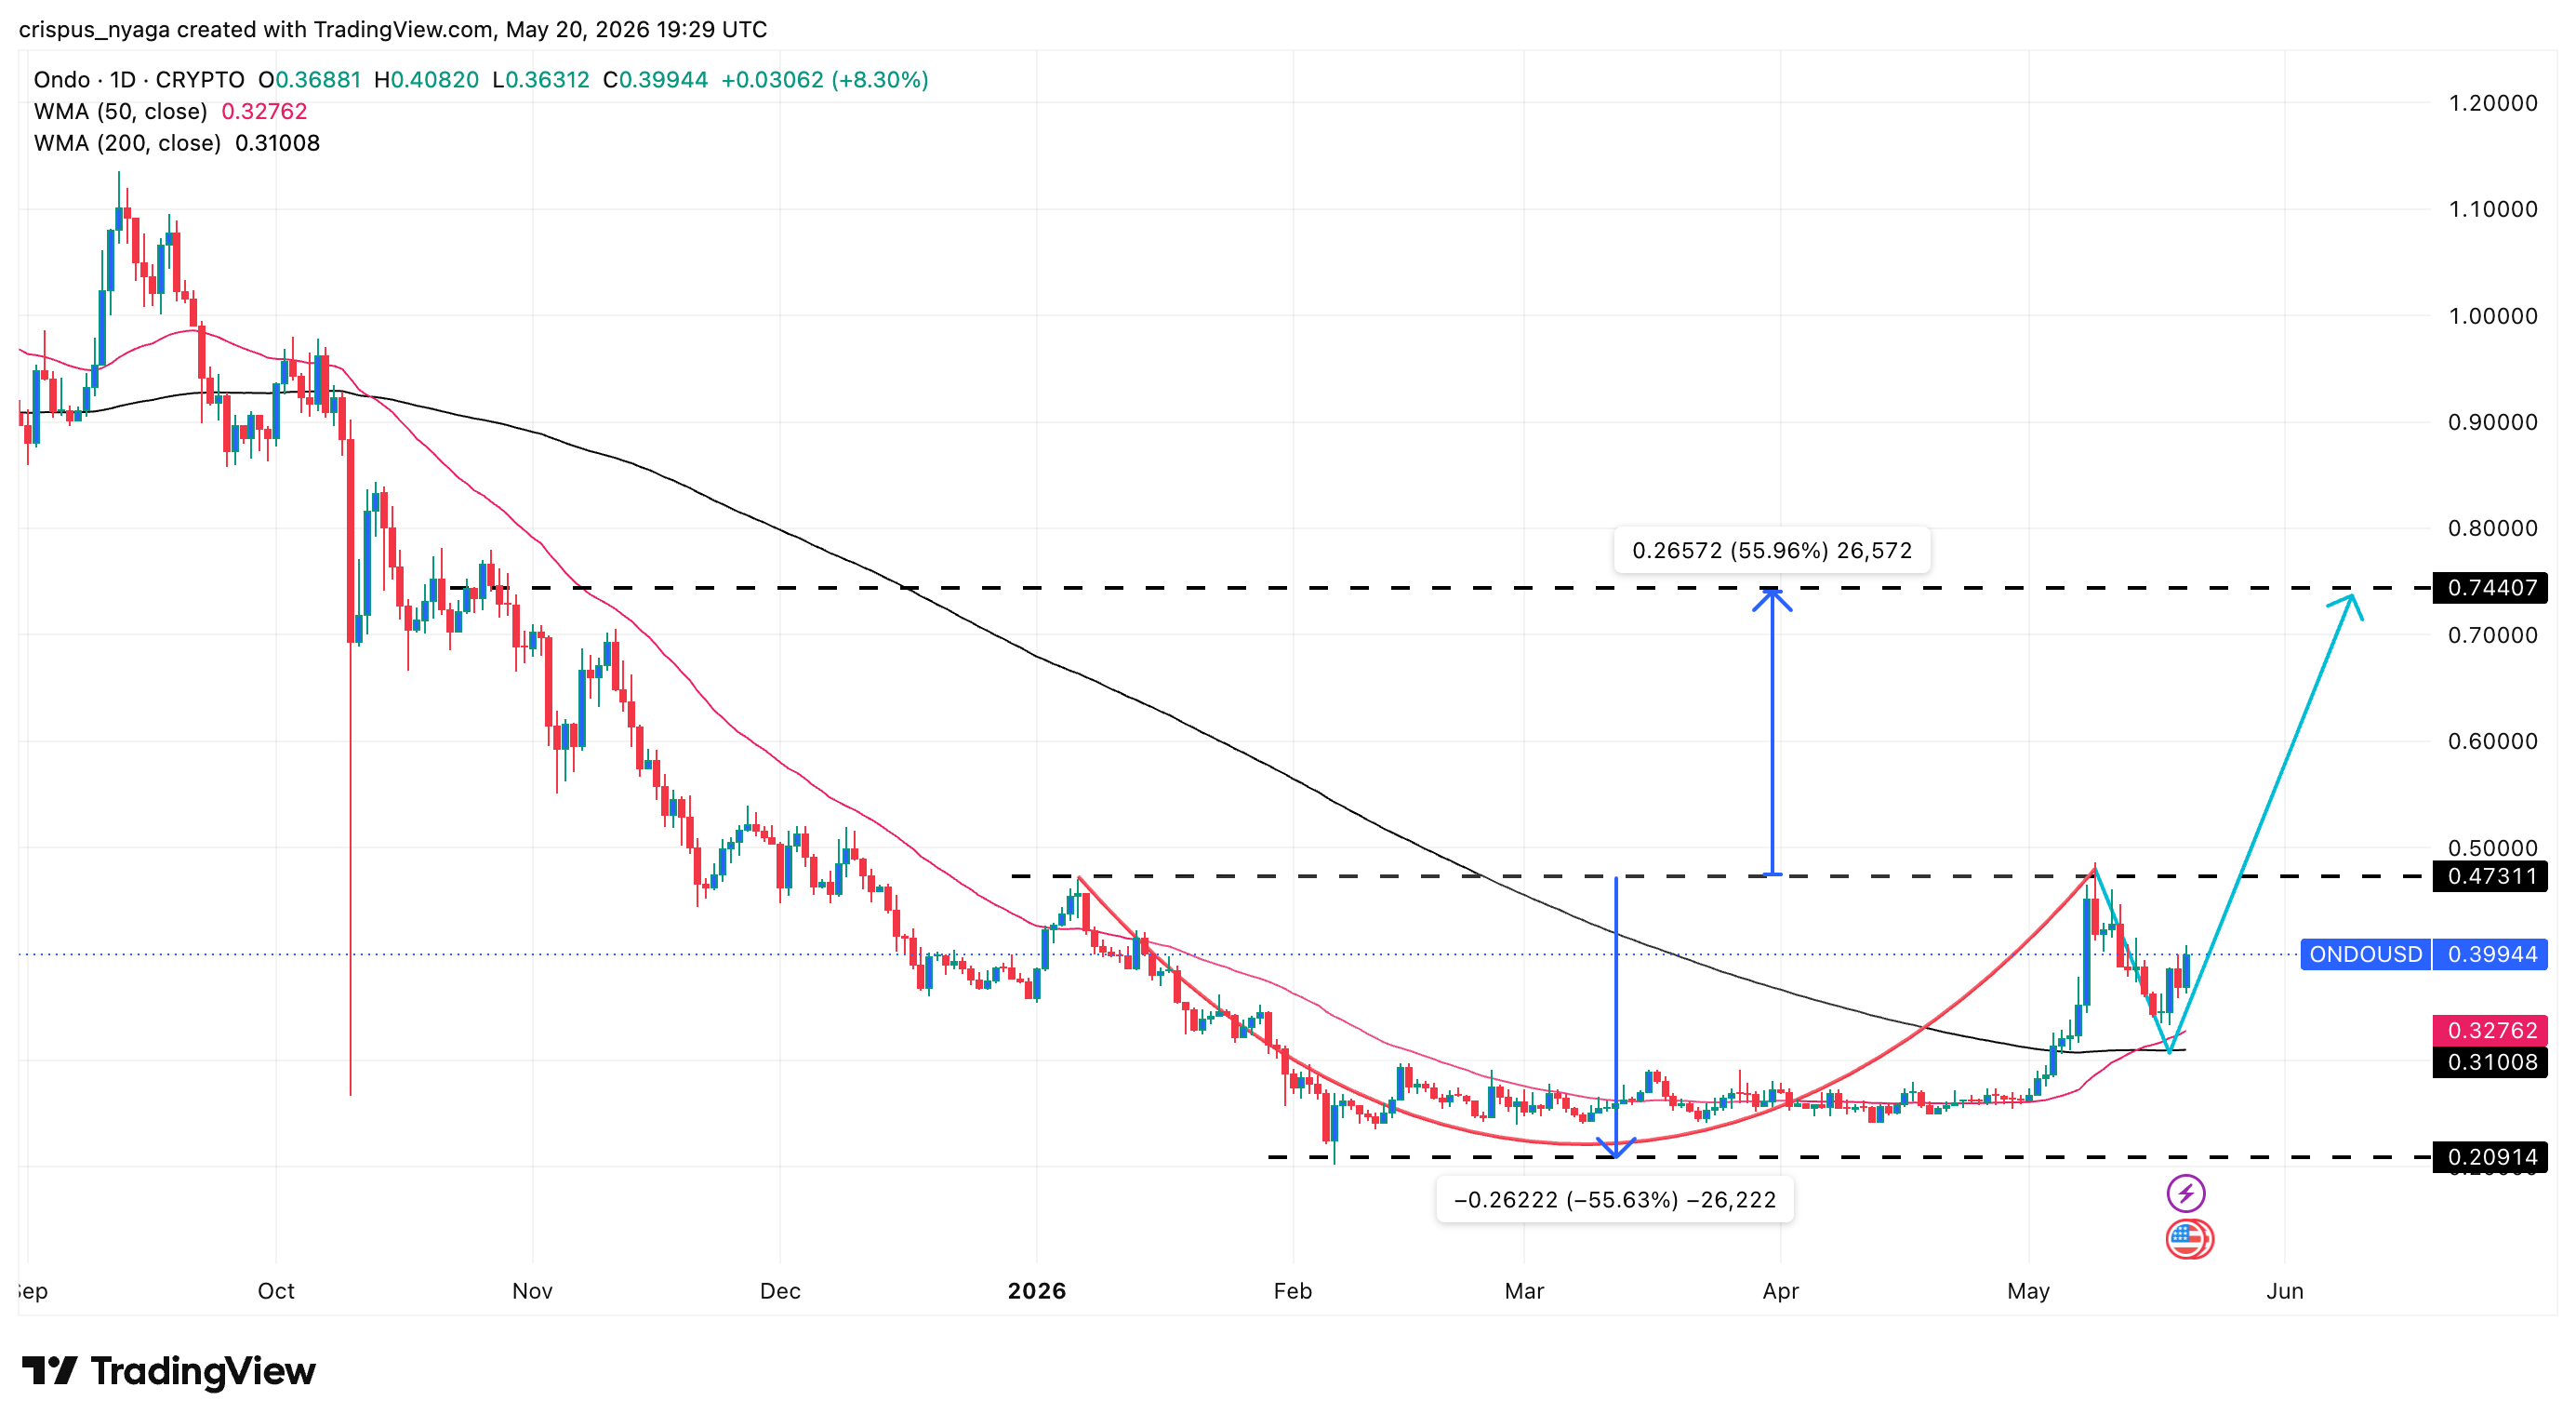
Ondo Finance token has also rebounded in the past few days, helped by the ongoing ecosystem growth. Its total value locked has jumped to a record high, while Ondo Global Markets, its RWA platform is firing on all cylinders with the TVL crossing the $1 billion mark.
The coin has formed some highly bullish chart patterns, pointing to more gains in the near term. For example, it has formed a cup-and-handle pattern and is now in the latter section. This pattern has a depth of about 55%, pointing to an eventual rally towards $0.7440.
Pi Network Price Prediction
The daily chart shows that the Pi Coin price has crashed in the past few days, and is slowly nearing its all-time low. This retreat happened as the network completed its V23 upgrade that introduced smart contracts.
There are concerns about whether it will attract more developers to the network or whether it will become another ghost chain. It has dropped below the key support level at $0.1637, its lowest point on April 14.
The token has dropped below the 50-day and 100-day Exponential Moving Averages (EMA). Also, the Relative Strength Index (RSI) has continued falling.
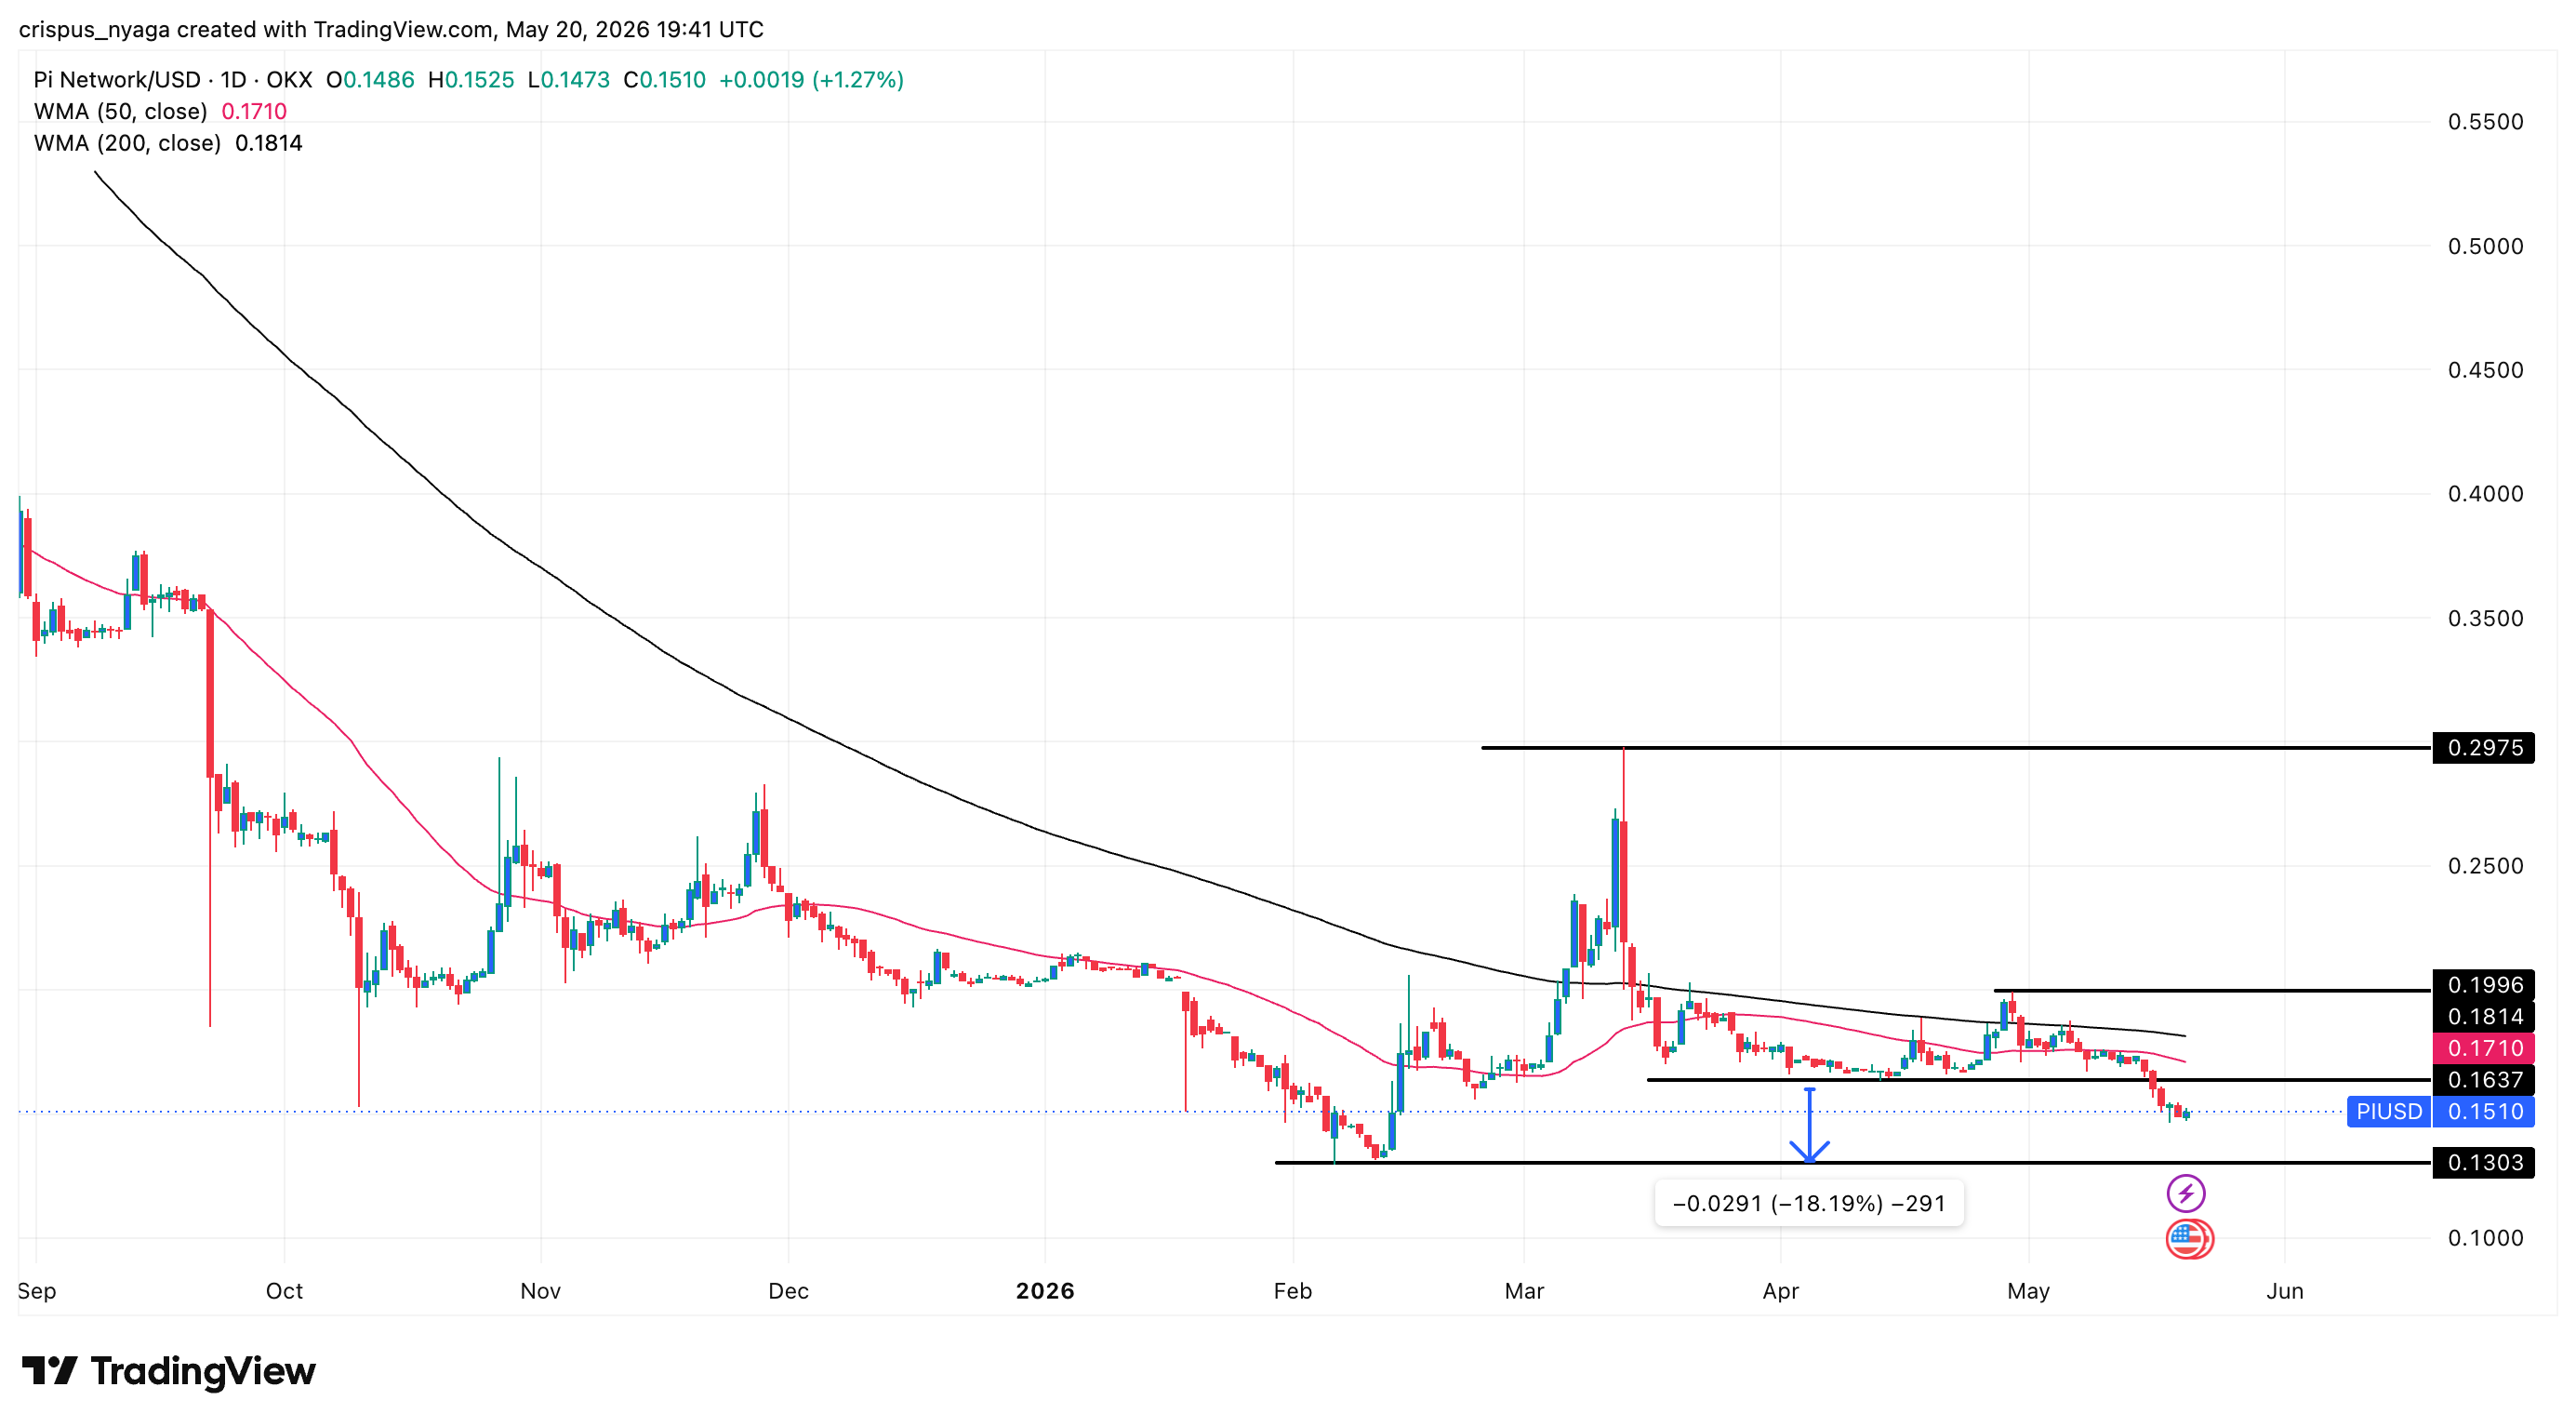
Therefore, the token will likely continue falling, potentially to its all-time low of $0.1300, its lowest point on February 12.
XRP Price Prediction
Ripple token has crashed to its lowest point since April 12 this year. It has dropped by over 12% from its highest point this month. This retreat has happened despite the ongoing XRP ETF inflows, which have hit $94 million this month. They have soared to the highest point this year, bringing the total assets to $1.4 billion.
The challenge, however, is that there are signs that the XRP price has remained below all moving averages. It has also formed a bearish flag pattern, a common bearish sign in technical analysis.
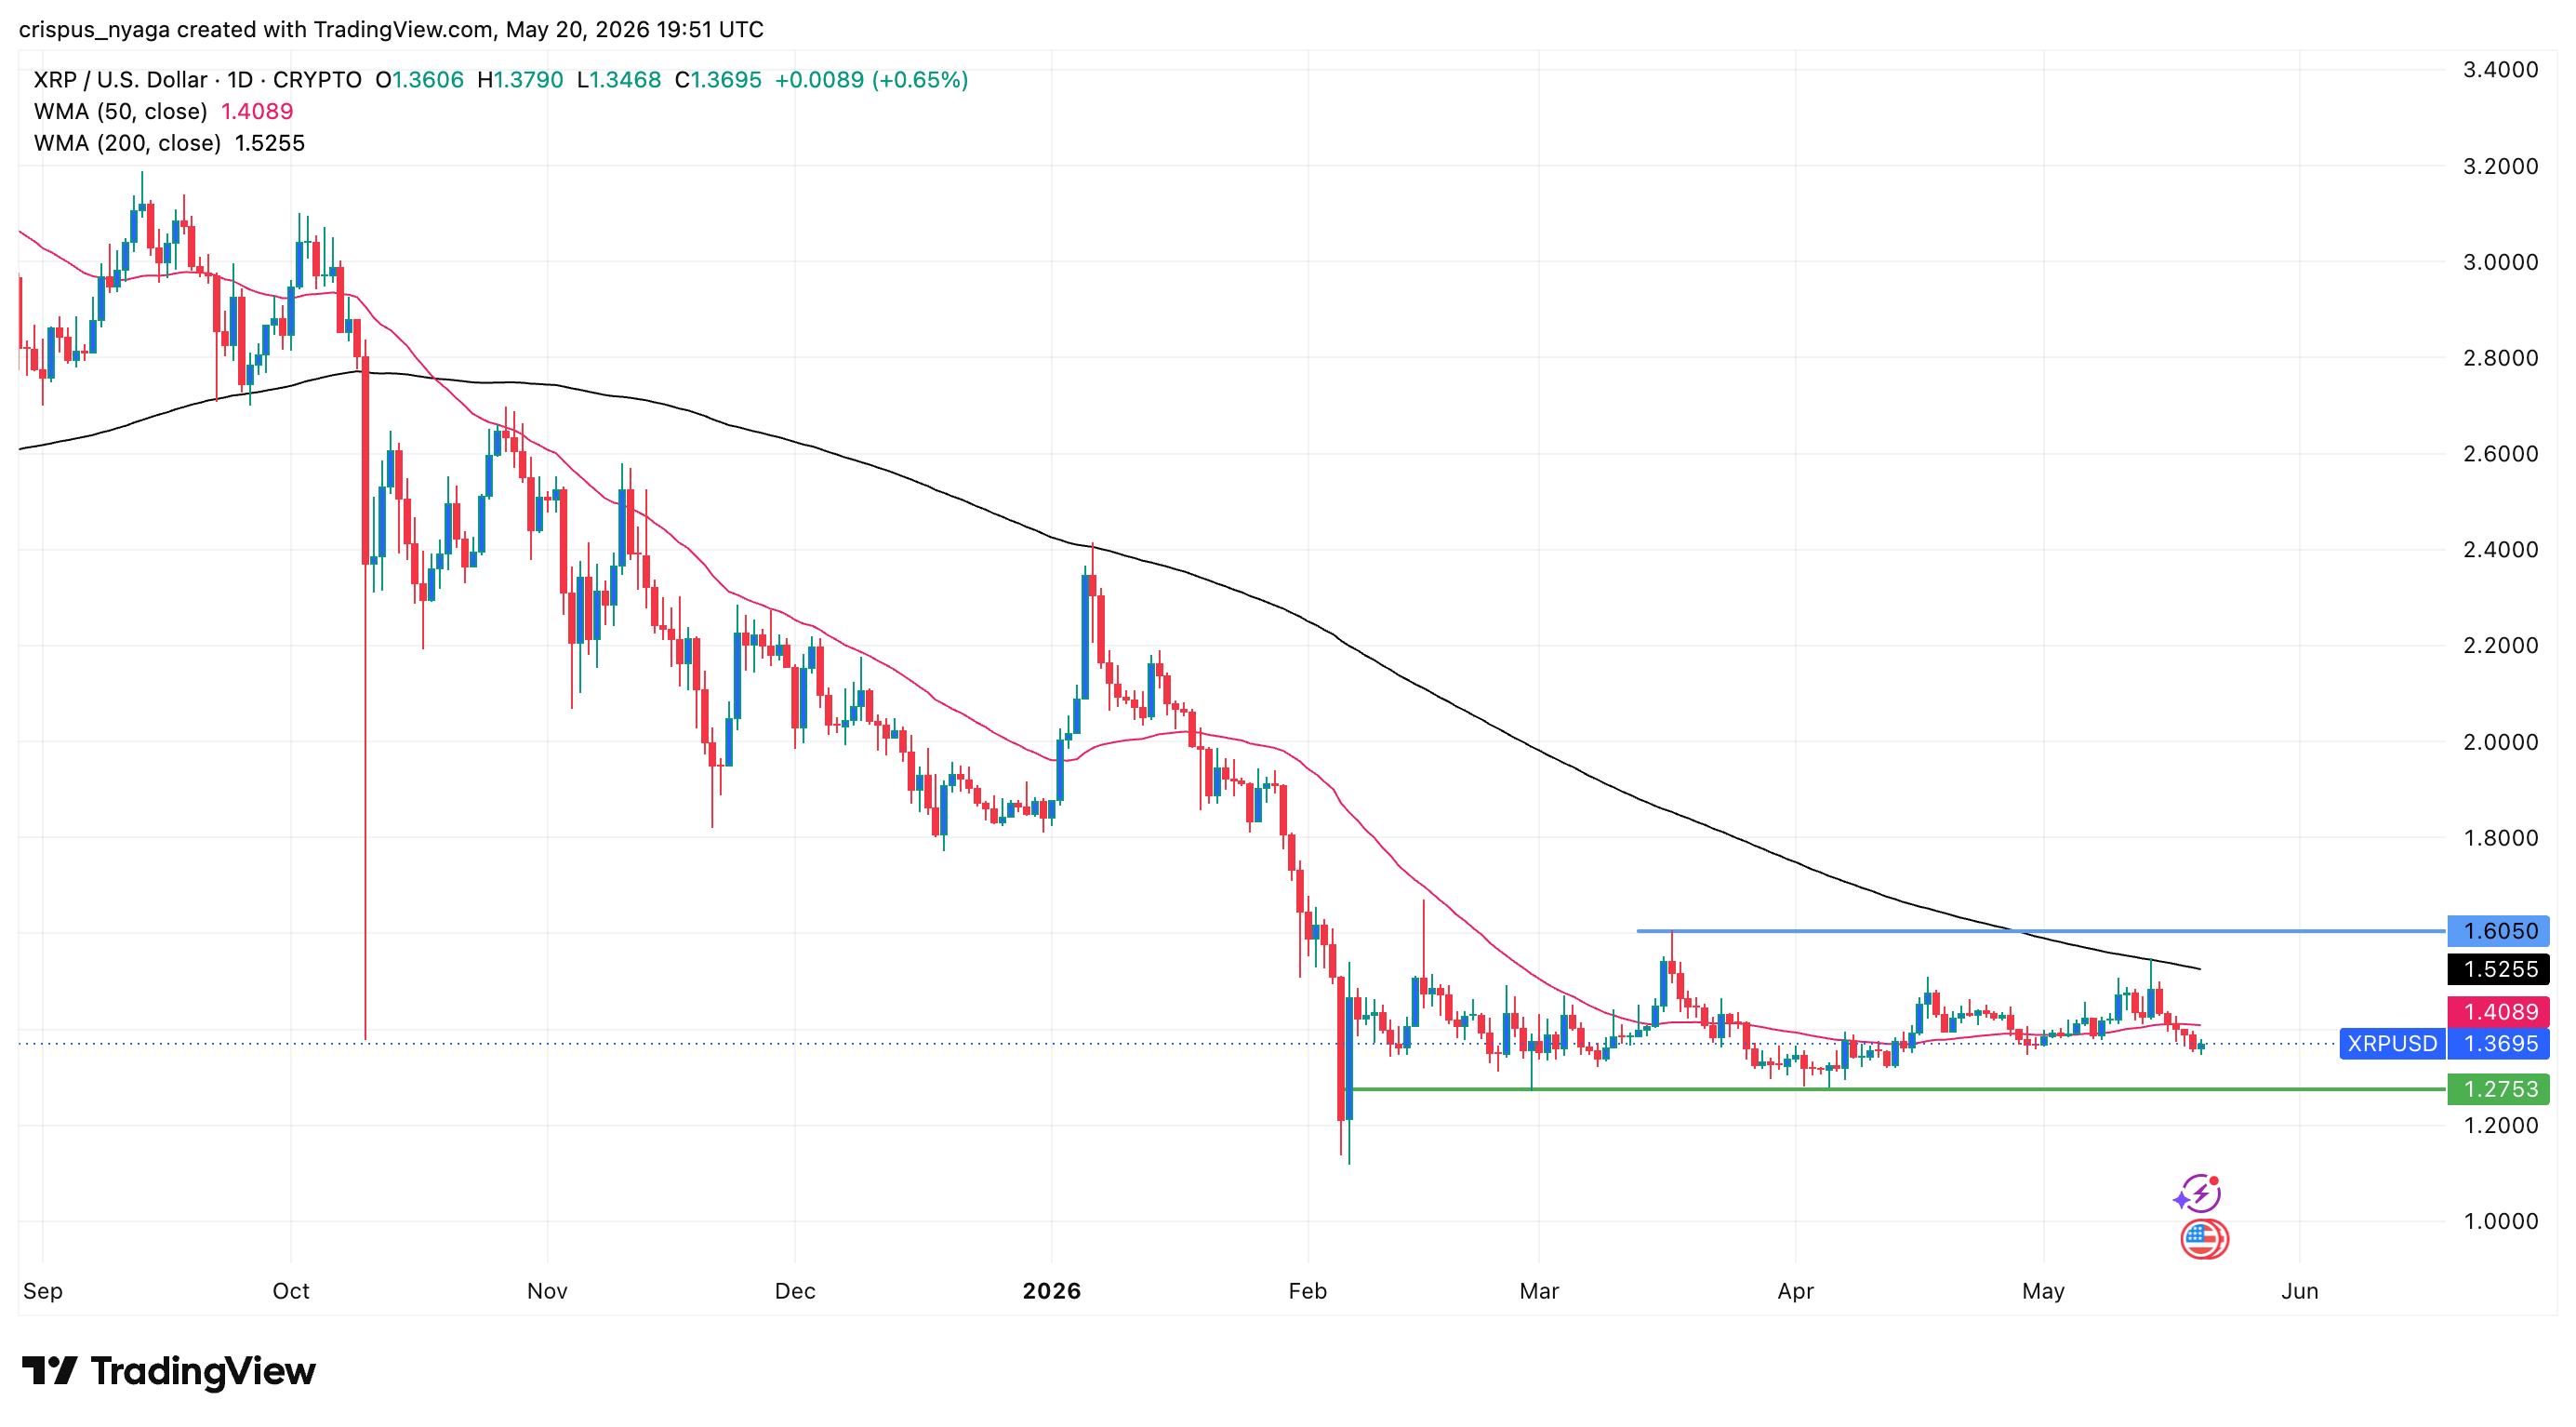
On the positive side, there are signs that the coin has formed an accumulation phase of the Wyckoff Theory. This pattern is usually followed by the markup phase, which is usually highly bullish. A move above the key resistance at $1.6050 will point to more gains over time.
READ MORE: Hyperliquid Token Price Eyes a 25% Surge: Here’s the Top Catalysts for HYPE