


- XRP price has remained in a box in the past four months.
- Ripple ETF inflows have jumped to the highest level this year.
- In contrast, Bitcoin and Ethereum ETF inflows have dwindled.
XRP price remained on edge today, May 23rd, mirroring the performance of the broader crypto industry. Ripple token dropped to $1.3365 today, its lowest level since April 13. It has dropped by 15% from its highest point this year despite the ongoing smart money accumulation.
XRP Price Drops Despite Smart Money Accumulation
There are signs that the XRP token is in the accumulation phase, which has lasted for more than four months. The best example of this is the ongoing XRP ETF inflows, which have continued this month.
These funds have added assets in the last seven consecutive days, bringing the monthly increase to over $114 million. This makes it the best month since December last year when they added over $499 million in assets.
In total, these funds have had net inflows of $1.41 billion since their inception, bringing the total net assets to $1.13 billion. Bitwise, Canary, Franklin, and 21Shares are the leading XRP ETFs in terms of assets.
READ MORE: Traders Bet Against IONQ, RGTI, QBTS, QUBT, INFQ Stocks Amid Quantum Computing Hype
In contrast, spot Bitcoin ETF inflows have faded. After adding $1.6 billion in assets in the first six days, these funds have now had substantial outflows in the past few weeks. Their net outflows stand at over $1 billion this month, ending a two-month winning streak.
Spot Solana ETF inflows have had over $112 million in inflows, while those tracking Ethereum shed nearly $300 million in assets. Dogecoin and Avalanche have had no major inflows.
Therefore, the divergence between spot XRP and Bitcoin inflows metrics means that smart money investors expect the latter to rebound in the coming months or weeks.
Still, fundamentally, XRP is sending mixed signals. While the XRP Ledger network is thriving in terms of the Real-World Asset (RWA) industry, its on-chain metrics have waned. Data shows that the number of transfers and XRP holders has remained under pressure in the past few months.
Ripple Price Prediction: Technical Analysis
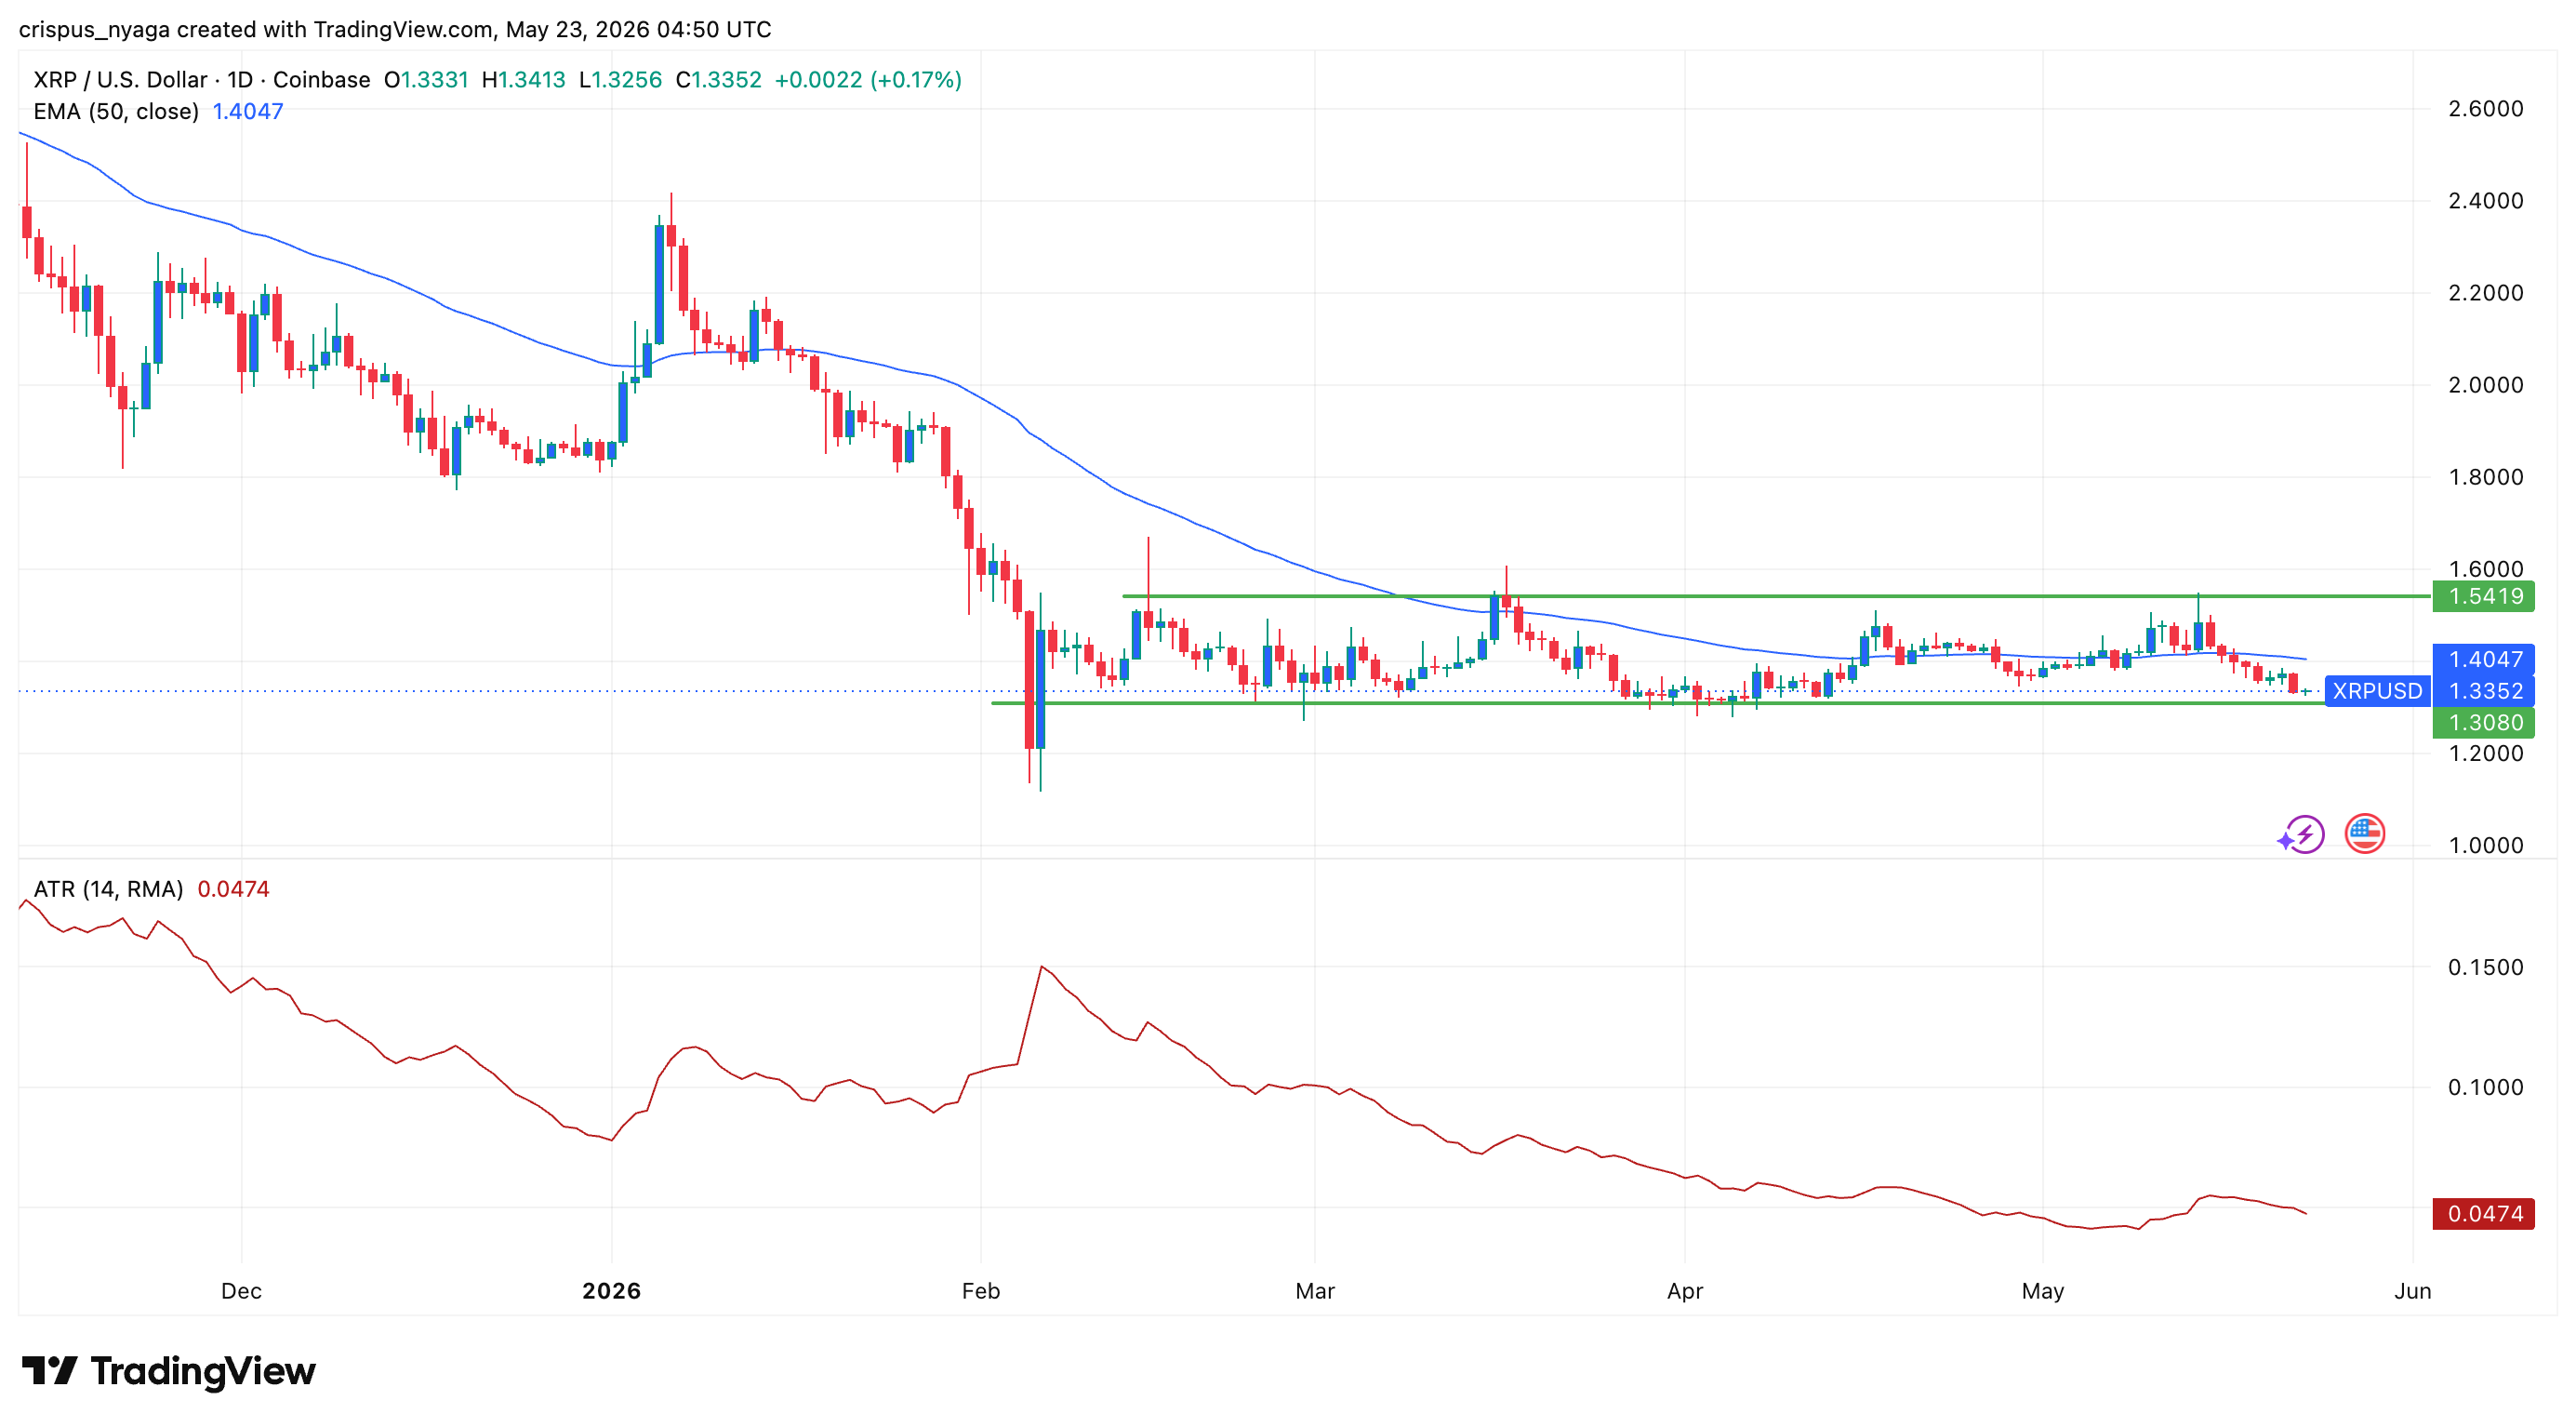
XRP price chart | Source: TradingView
The daily chart shows that the XRP price has remained in a narrow range in the past four months. In this period, it has underperformed some of the most popular tokens in the industry like HYPE and Venice Token.
The coin has formed a horizontal channel whose lower and upper sides are at $1.3080 and $1.5420. The Average True Range (ATR) has been subdued, a sign that volatility has continued to dwindle.
XRP remains slightly below the 50-day and 100-day Exponential Moving Averages (EMA). Also, the Relative Strength Index (RSI) has continued falling.
On the positive side, the ongoing smart money buying is a sign that the coin has moved into the accumulation phase of the Wyckoff Theory. This phase is then followed by markup, where an asset often goes parabolic.
The bullish XRP price forecast will become invalid if it drops below the crucial support level at $1.30. Such a move will mean that bears have prevailed, pushing it lower.
READ MORE: Worldcoin Price Shows Bottoming Signs Ahead of OpenAI IPO