



- Sandisk stock price has soared by over 4,000% in the last 12 months.
- The company’s revenue growth is soaring amid the elevated memory prices.
- It has formed a double-top pattern, pointing to a brief retreat.
Sandisk stock price is firing on all cylinders, making it the best-performer in the S&P 500 Index. It has soared by 545% this year and by 4,050% in the last 12 months. Lumentum, the second-best performer in the S&P 500 Index, has jumped by 1,000% in the same period. So, does the stock have more upside?
Sandisk Stock Has Soared Because of Data Center Demand and Momentum
The artificial intelligence boom is continuing this year. While most attention has remained on popular names like NVIDIA and AMD, most of the action has been happening in the sector’s more boring corners.
Sandisk, a company that makes SSD and other memory products, has become the best-performing player in the S&P 500 Index this year. The others are Intel, Micron, Seagate, Western Digital, and Dell. Intel is a top maker of CPUs, while the others are in the memory space.
READ MORE: Nebius Stock Price is Flashing Red: Is a Deep Reversal Coming?
Sandisk stock has jumped because of the rising demand for its memory solutions. Its most recent results showed that its revenue jumped by 97% from the previous quarter to $5.95 billion. It rose by 250% from the same period last year.
Analysts are optimistic about its revenue and profit trajectory. The average estimate is that its revenue will jump by 165% this year to $20 billion followed by 116% to $42 billion. It may cross the $50 billion level in the next few years.
Sandisk is also benefiting from its high margins as memory demand jumps. Its profit margin stands at 34%, and the company may push it to over 40% as long as prices remain elevated.
Most importantly, there are signs that the stock is not all that overvalued despite its strong bull run. It has a forward price-to-earnings ratio of 24, slightly higher than S&P 500 Index’s 23.
Still, there is a risk that the stock has gone up too quickly, meaning that it may retreat as investors book profits. It may also come in trouble when SSD prices start falling, which may happen in the next two years.
SNDK Stock Price Forecast: Technical Analysis
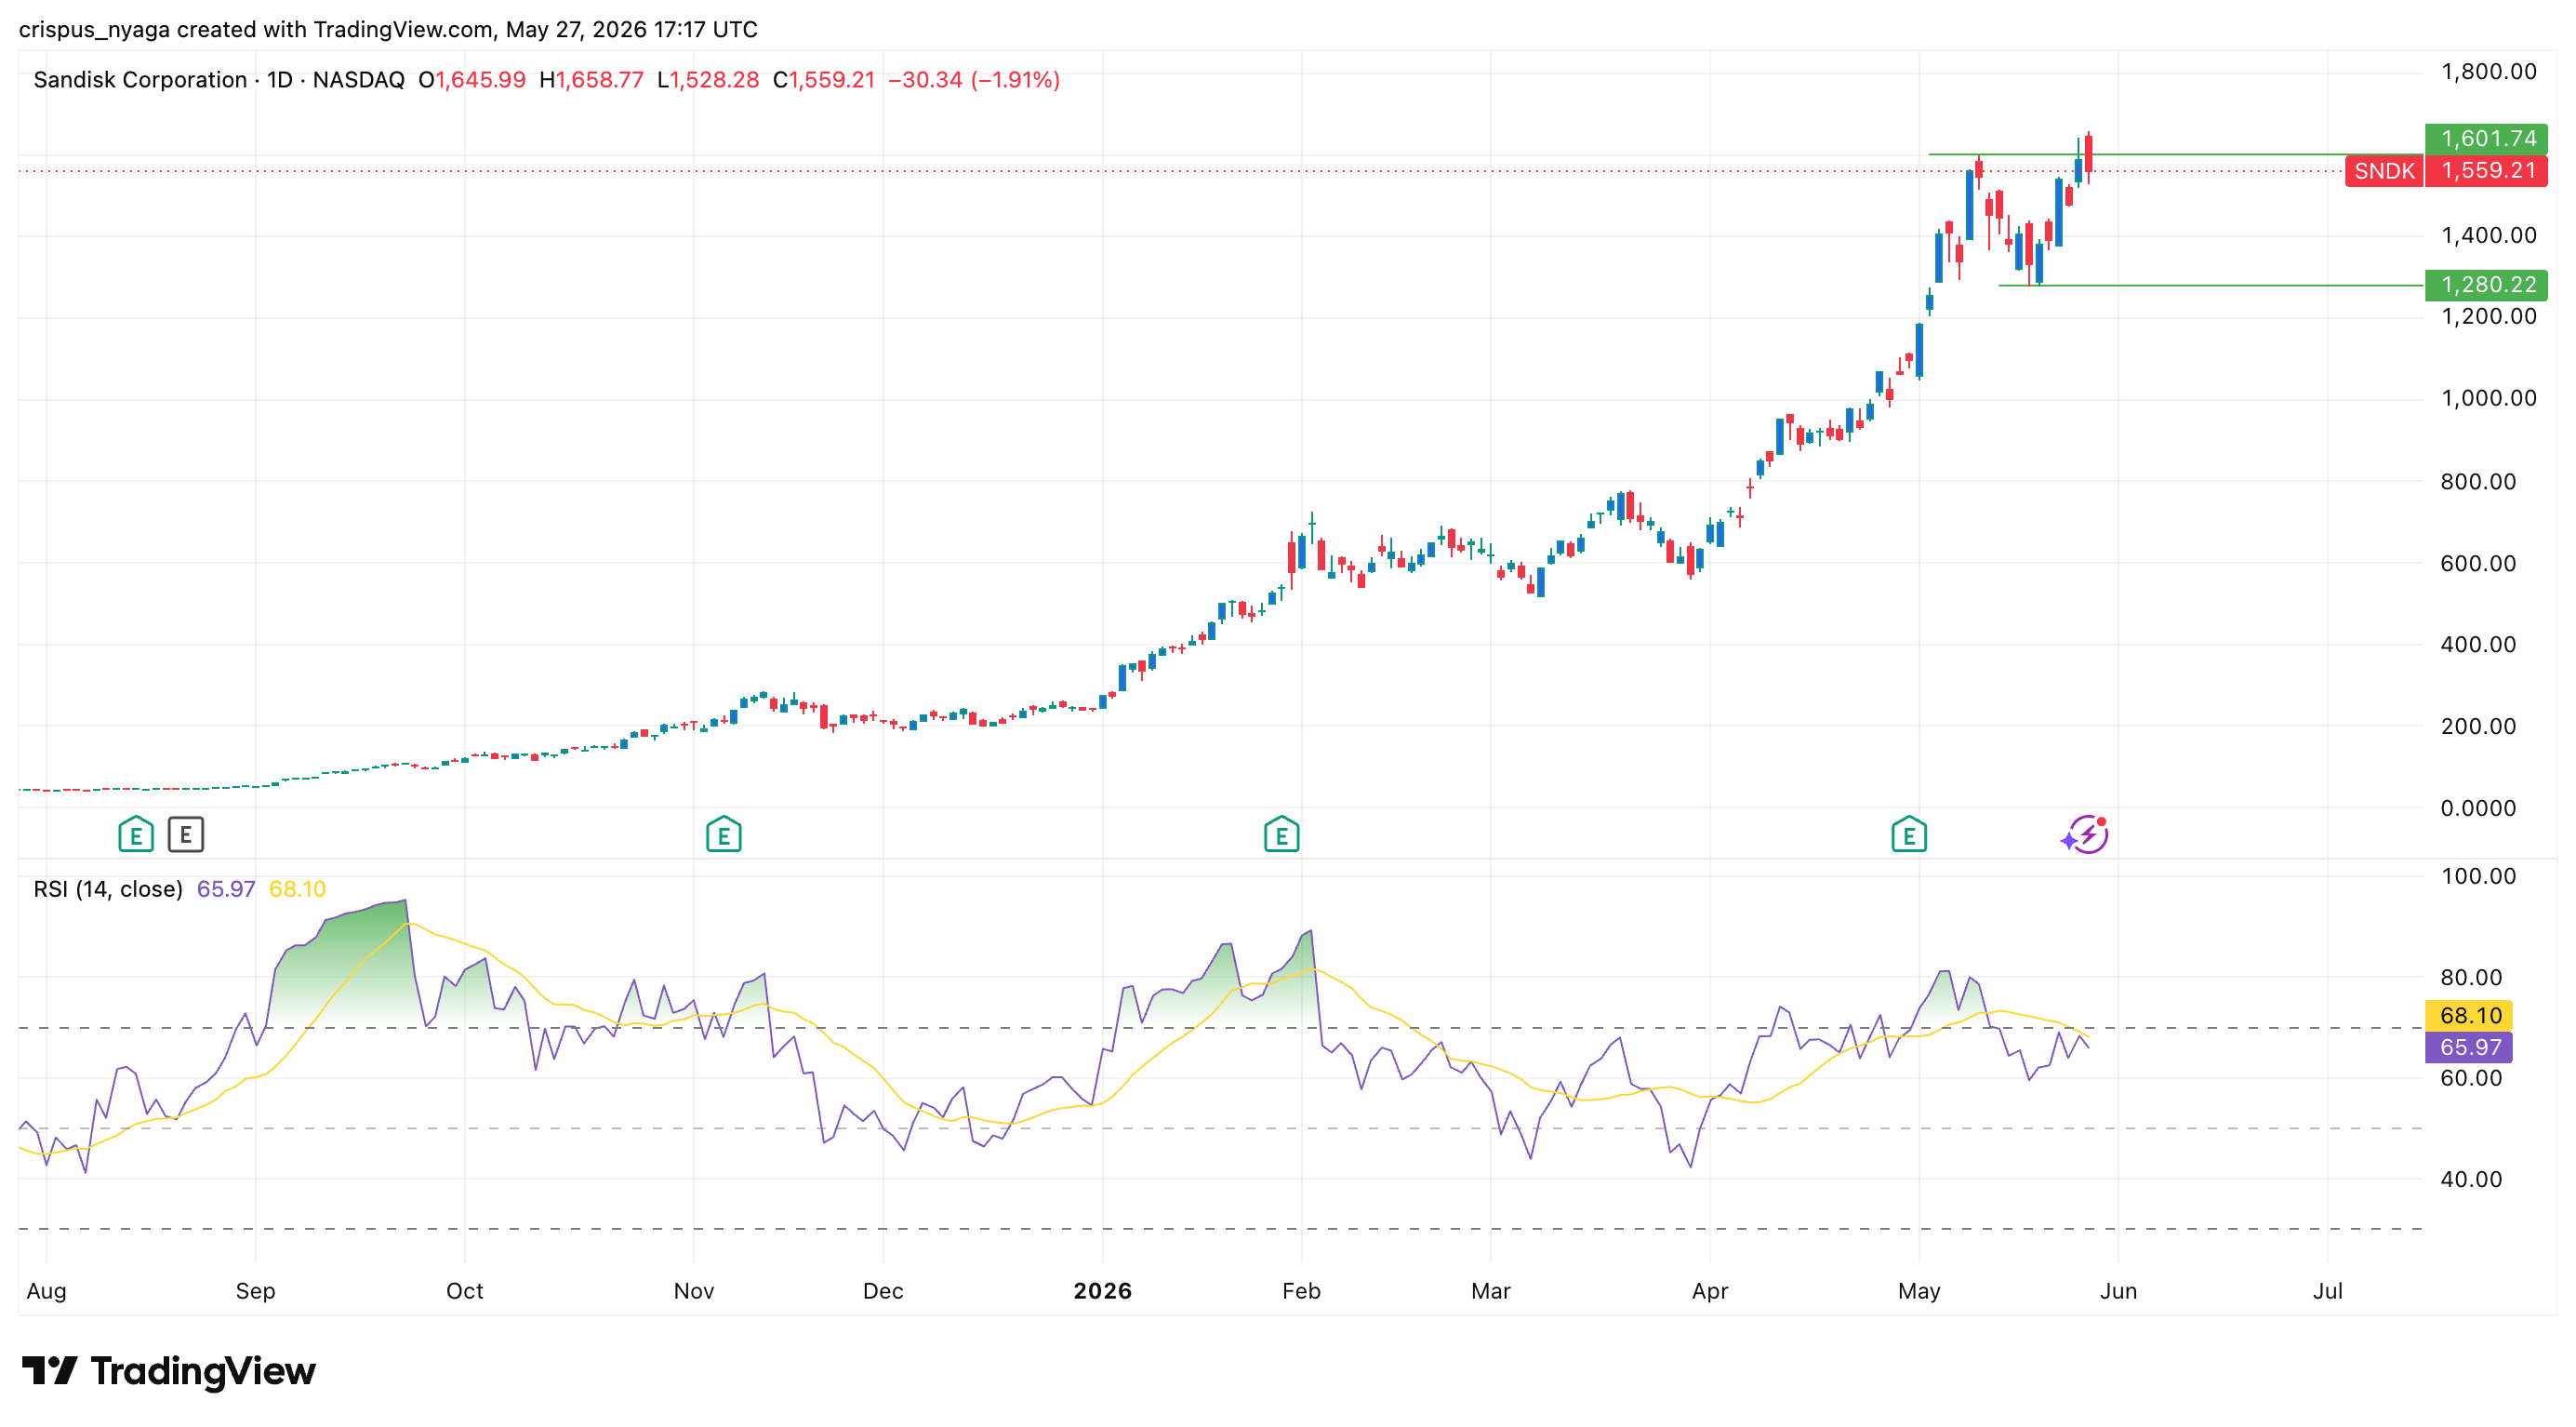
The daily chart shows that the SDNK stock price has surged this year and is hovering at its all-time high. Still, there is a risk that it may experience a short-term pullback in the near term. It has formed a double-top pattern at $1,601 and a neckline at $1,280, its lowest level on May 18. A double-top is usually followed by a retreat.
The Relative Strength Index (RSI) has formed a bearish divergence pattern, which happens when it is falling during a rally. It has also moved below the moving average. Therefore, the stock may retreat to the key support level at $1,280, the neckline of the double-top, which is about 18% below the current level.
READ MORE: Why is Terra Luna Classic (LUNC) Beating Bitcoin, Pi Network, and Top Altcoins?