

- Litecoin has formed an inverted head and shoulders pattern on the 1D chart.
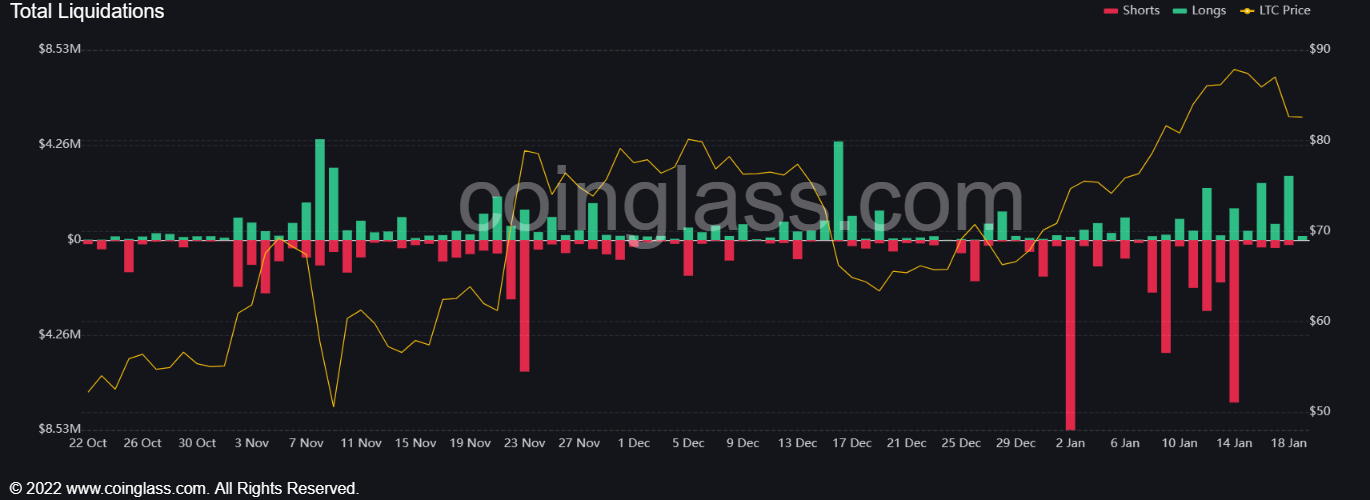
- Long liquidations have overtaken short ones in the past few days.
- The retreat mirrors that of the Dow Jones and Nasdaq 100.
Cryptocurrencies pulled back this week following the worrying quarterly results by some of the biggest American companies. Litecoin price pulled back from the year-to-date high of $90.98 to a low of $82.28. Still, it is one of the best-performing big-cap crypto having soared by over 103% from last year’s low.
Long liquidations rise
Litecoin has pulled back in the past few days. This performance is mostly in sync with the performance of American indices like the Dow Jones and the Nasdaq 100. The Nasdaq 100 index has pulled back by about 2.50% from its highest point in 2023.
A key reason for that is that the earnings season is not going on well. Last week, top Wall Street banks like JP Morgan, Citigroup, and Wells Fargo published weak results. This trend continued this week with firms like Goldman Sachs and Morgan Stanley publishing weak results.
A closer look at most banks shows that they are all bracing for a mild recession. This is seen by the amount of money they are allocating in provisions for credit losses. At the same time, banks have started implementing mass layoffs. Goldman is laying off over 3,200 workers.
Companies in other industries are also bracing for more job cuts. For example, Microsoft is firing over 10,000 people while Salesforce is cuttting 10% of its workers. Therefore, there are concerns about the economy, which explains why stocks have plunged.
Find out how to buy Litecoin.
Meanwhile, as shown below, most Litecoin short-sellers have been liquidating their positions in the past few weeks as prices rose. However, the trend has shifted in the past few days as longs start liquidating their positions. On Wednesday, longs liquidated positions worth over $2.86 million while shorts liquidated $223.9k worth of shorts. This is a sign that buyers are getting worried.
Litecoin prediction
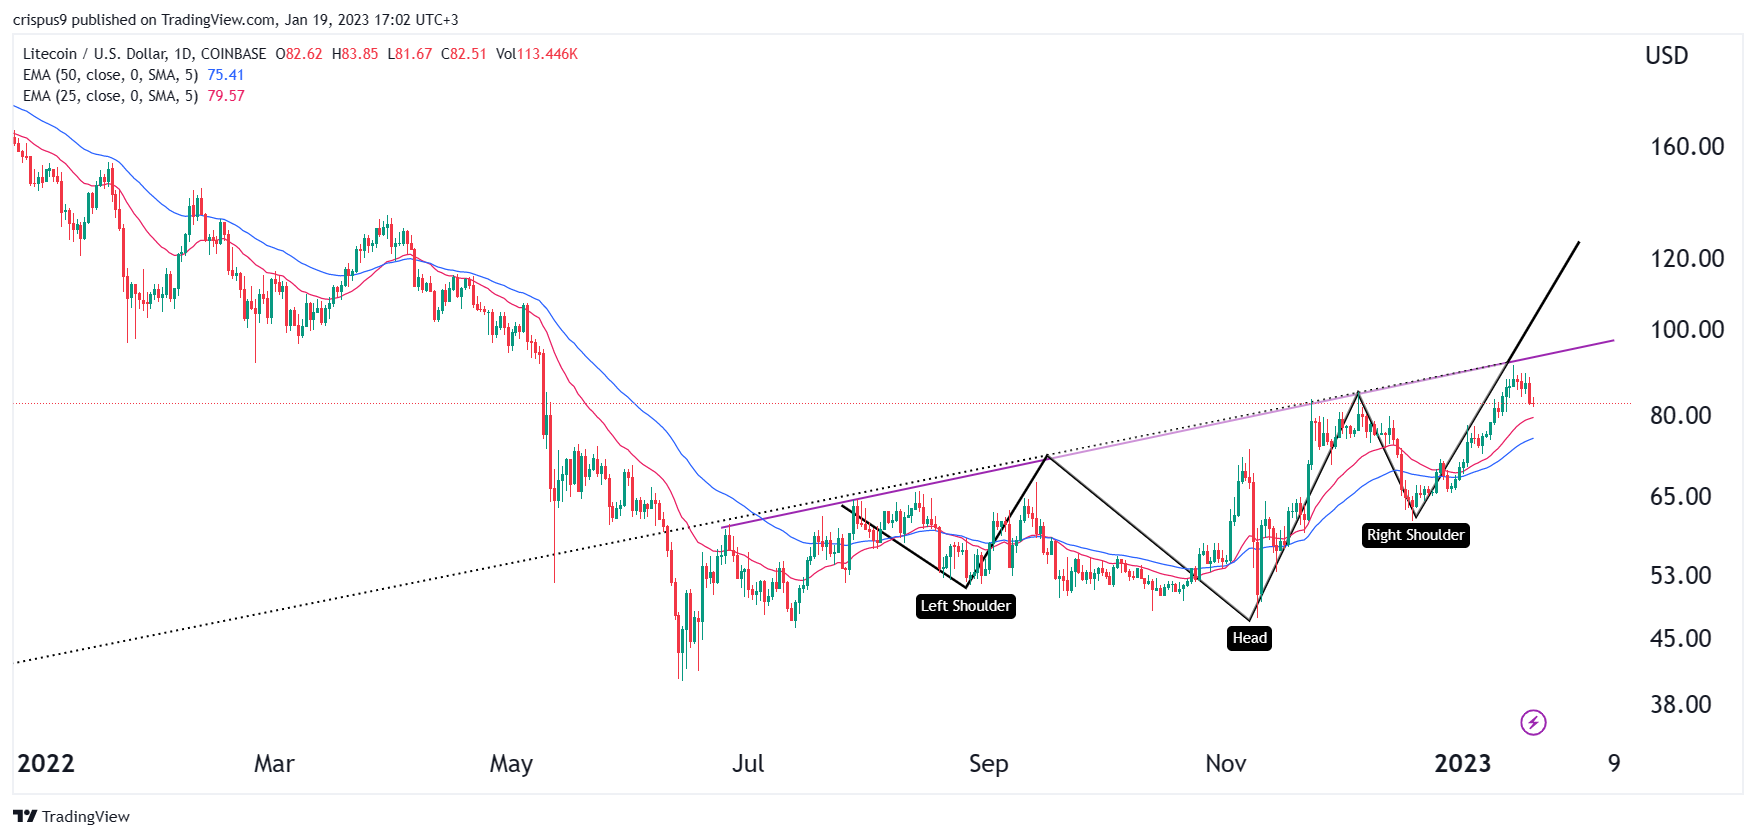
Technical analysis can play an important role in helping you know whether to buy or sell an asset. My previous LTC forecast worked well as it retested the target at $90.
The chart above shows that LTC has been forming an inverted and slanted head and shoulders pattern that is shown in black. This is one of the most accurate price action pattern although it takes time to form completely,
Another thing is that Litecoin price remains above the 2 moving averages. In trend-following, this is usually a sign that a financial asset will continue rising. Therefore, despite the pullback, I suspect that Litecoin will have a bullish breakout in the coming days. If this happens LTC will next retest the resistance at $100.


