


The ongoing Bitcoin price crash could be the beginning of a prolonged bear market, according to numerous chart patterns. BTC dropped to $112,000 on Monday, marking a technical correction after it fell by over 10% from its year-to-date high of $124,200.
Bitcoin Price Has Formed a Head & Shoulders Pattern
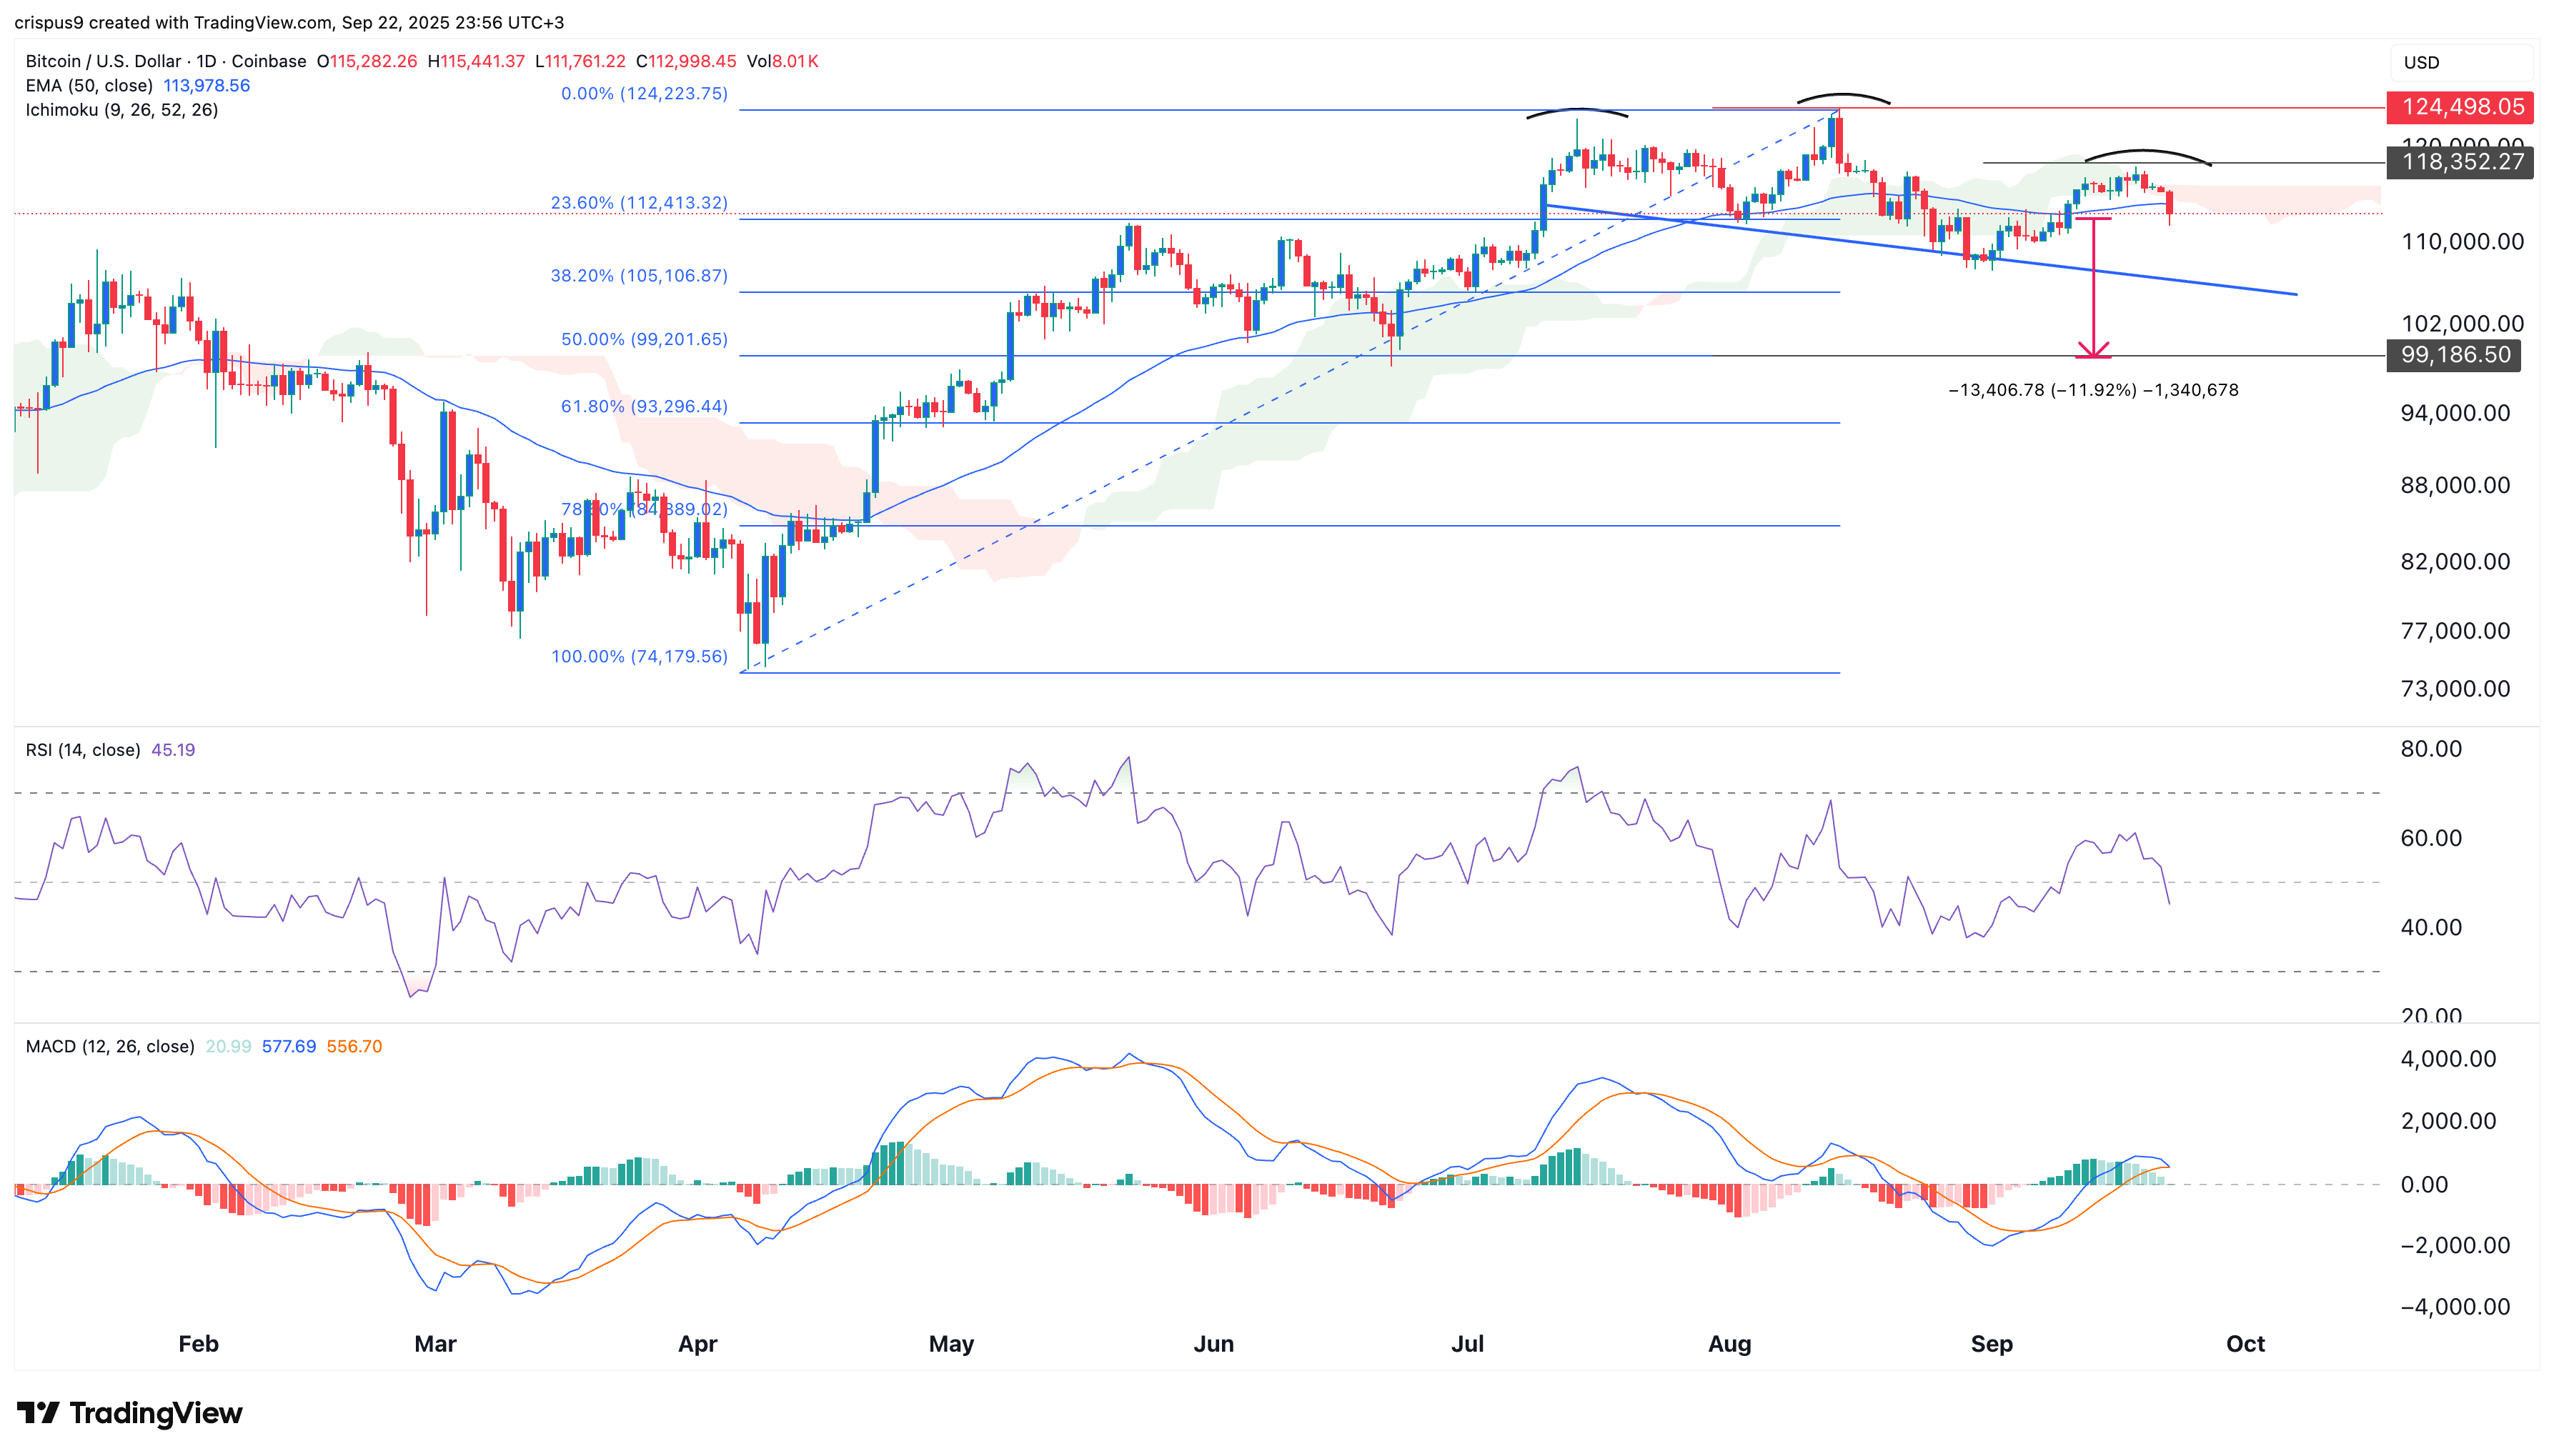
The first major risk for Bitcoin price is that it has formed a head-and-shoulders pattern on the daily chart. Its head is at the all-time high of $124,200, while the shoulders are between $118,000 and $119,000.
This H&S pattern has a slanted neckline, with a key point at $107,700. Worse, this pattern has coincided with its drop below the 50-day Exponential Moving Average (EMA) and the Ichimoku cloud indicator.
Additionally, the Relative Strength Index and the MACD indicators have continued to move downwards, indicating that the bearish trend is gaining momentum.
READ MORE: HBAR Price Prediction: Hedera Elliot Wave Points to a Surge
In this case, the Bitcoin price may crash to $99,050, the 50% Fibonacci Retracement level, which is about 12% below the current level. A move above the right shoulder will invalidate the bearish forecast.
BTC Has Formed a Large Rising Wedge Pattern
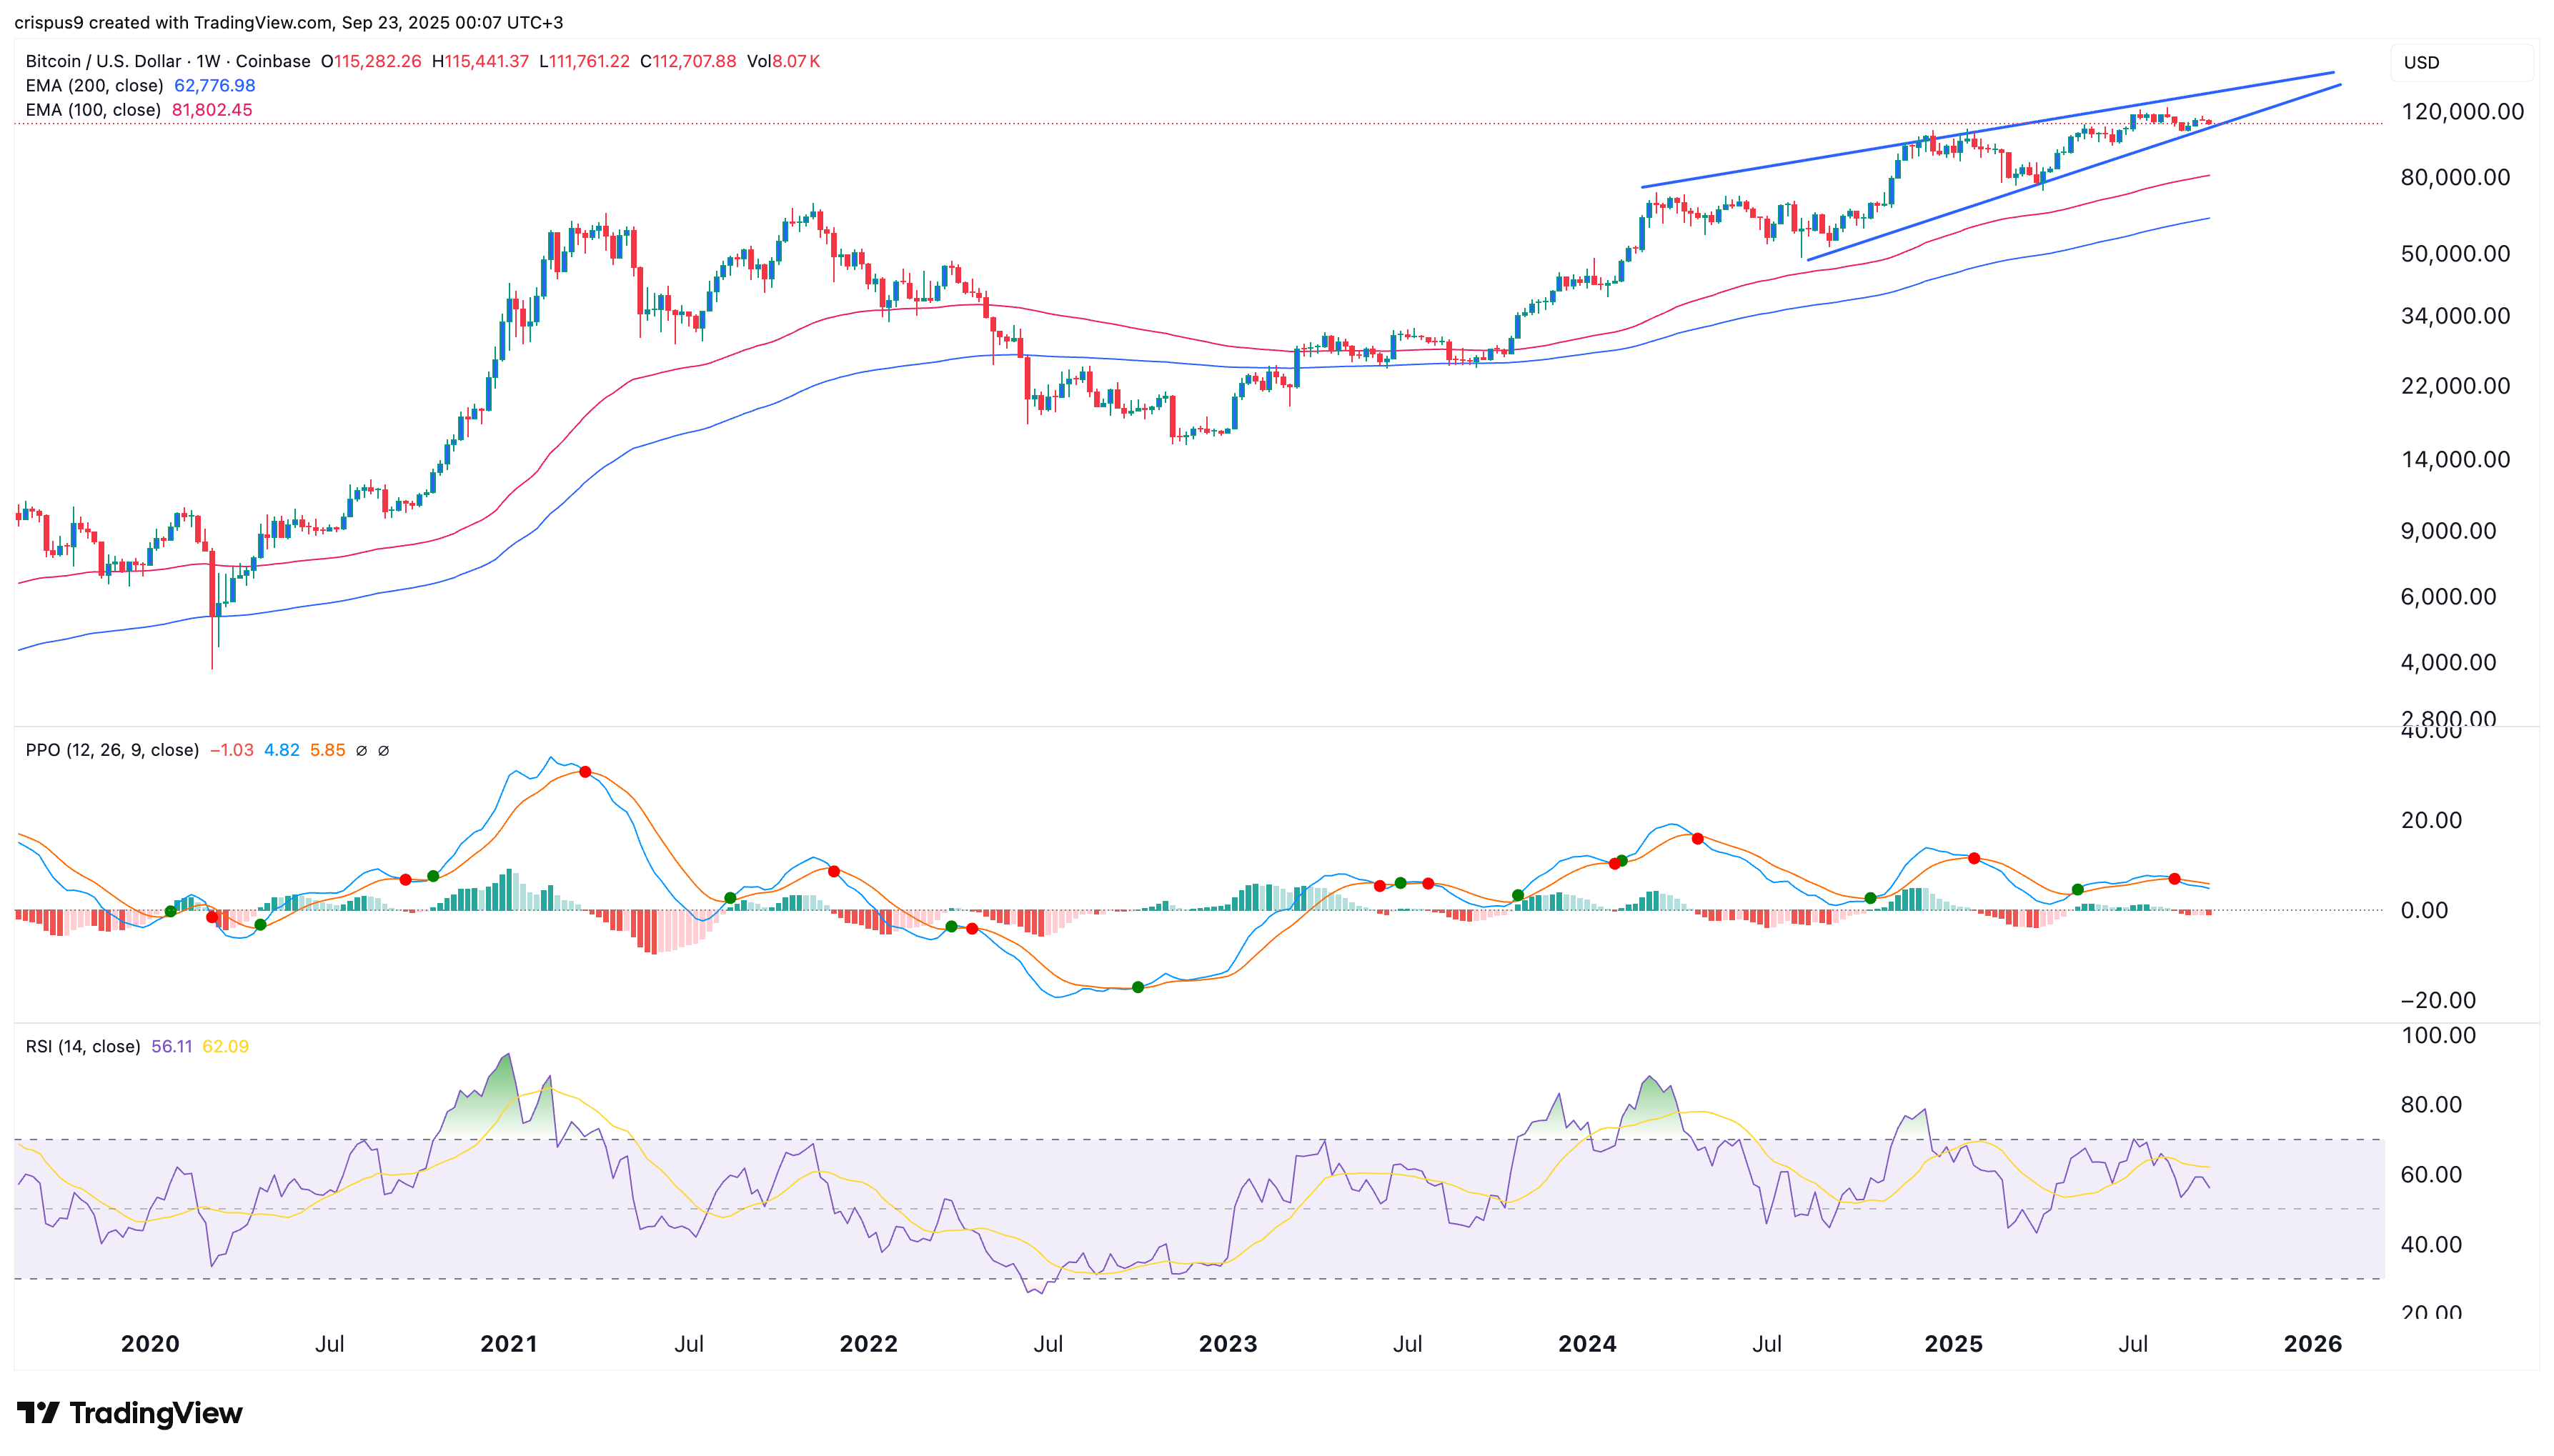
The riskiest pattern that the Bitcoin price has formed is on the weekly timeframe chart. This chart shows that the coin has formed a large rising wedge pattern.
The pattern has been forming since February last year, and the two trendlines are now nearing their confluence levels. Historically, a strong bearish breakdown normally happens when the two lines are about to converge.
The coin has also formed a bearish divergence pattern as the Percentage Price Oscillator has formed a series of lower lows and lower highs since March last year. Additionally, the Relative Strength Index (RSI) has formed a descending channel since that time, despite the surge in Bitcoin’s price.
Bitcoin also remains much higher than the 200-week Exponential Moving Average (EMA). This means that it may crash soon due to the combination of bearish divergence and mean reversion.
Mean reversion is a situation where an asset returns to its historical mean price. In this case, a bearish breakdown could see it drop to the 50-week EMA at $81,000, followed by the 200-week average at $63,000.
Historically, the Bitcoin price has seen such notable drawdowns. For example, it plunged by 78% from its highest level in November 2021 to its lowest level in December 2022. All its past declines have been good entry points as the coin has always jumped whenever it crashed.
READ MORE: Keeta Launches Mainnet to Challenge Solana, Ethereum, and Tron