

Solana is trying to claw its way back after a turbulent 48 hours that pushed SOL crypto sentiment into fear territory and dragged the Solana price as low as $129.02.
The latest bounce toward $142–$145 is encouraging, but analysts are far from aligned on what comes next, and both sides make valid points when you look at the Solana price chart.
Solana Price Rebounds as ETF Flows Hold Steady
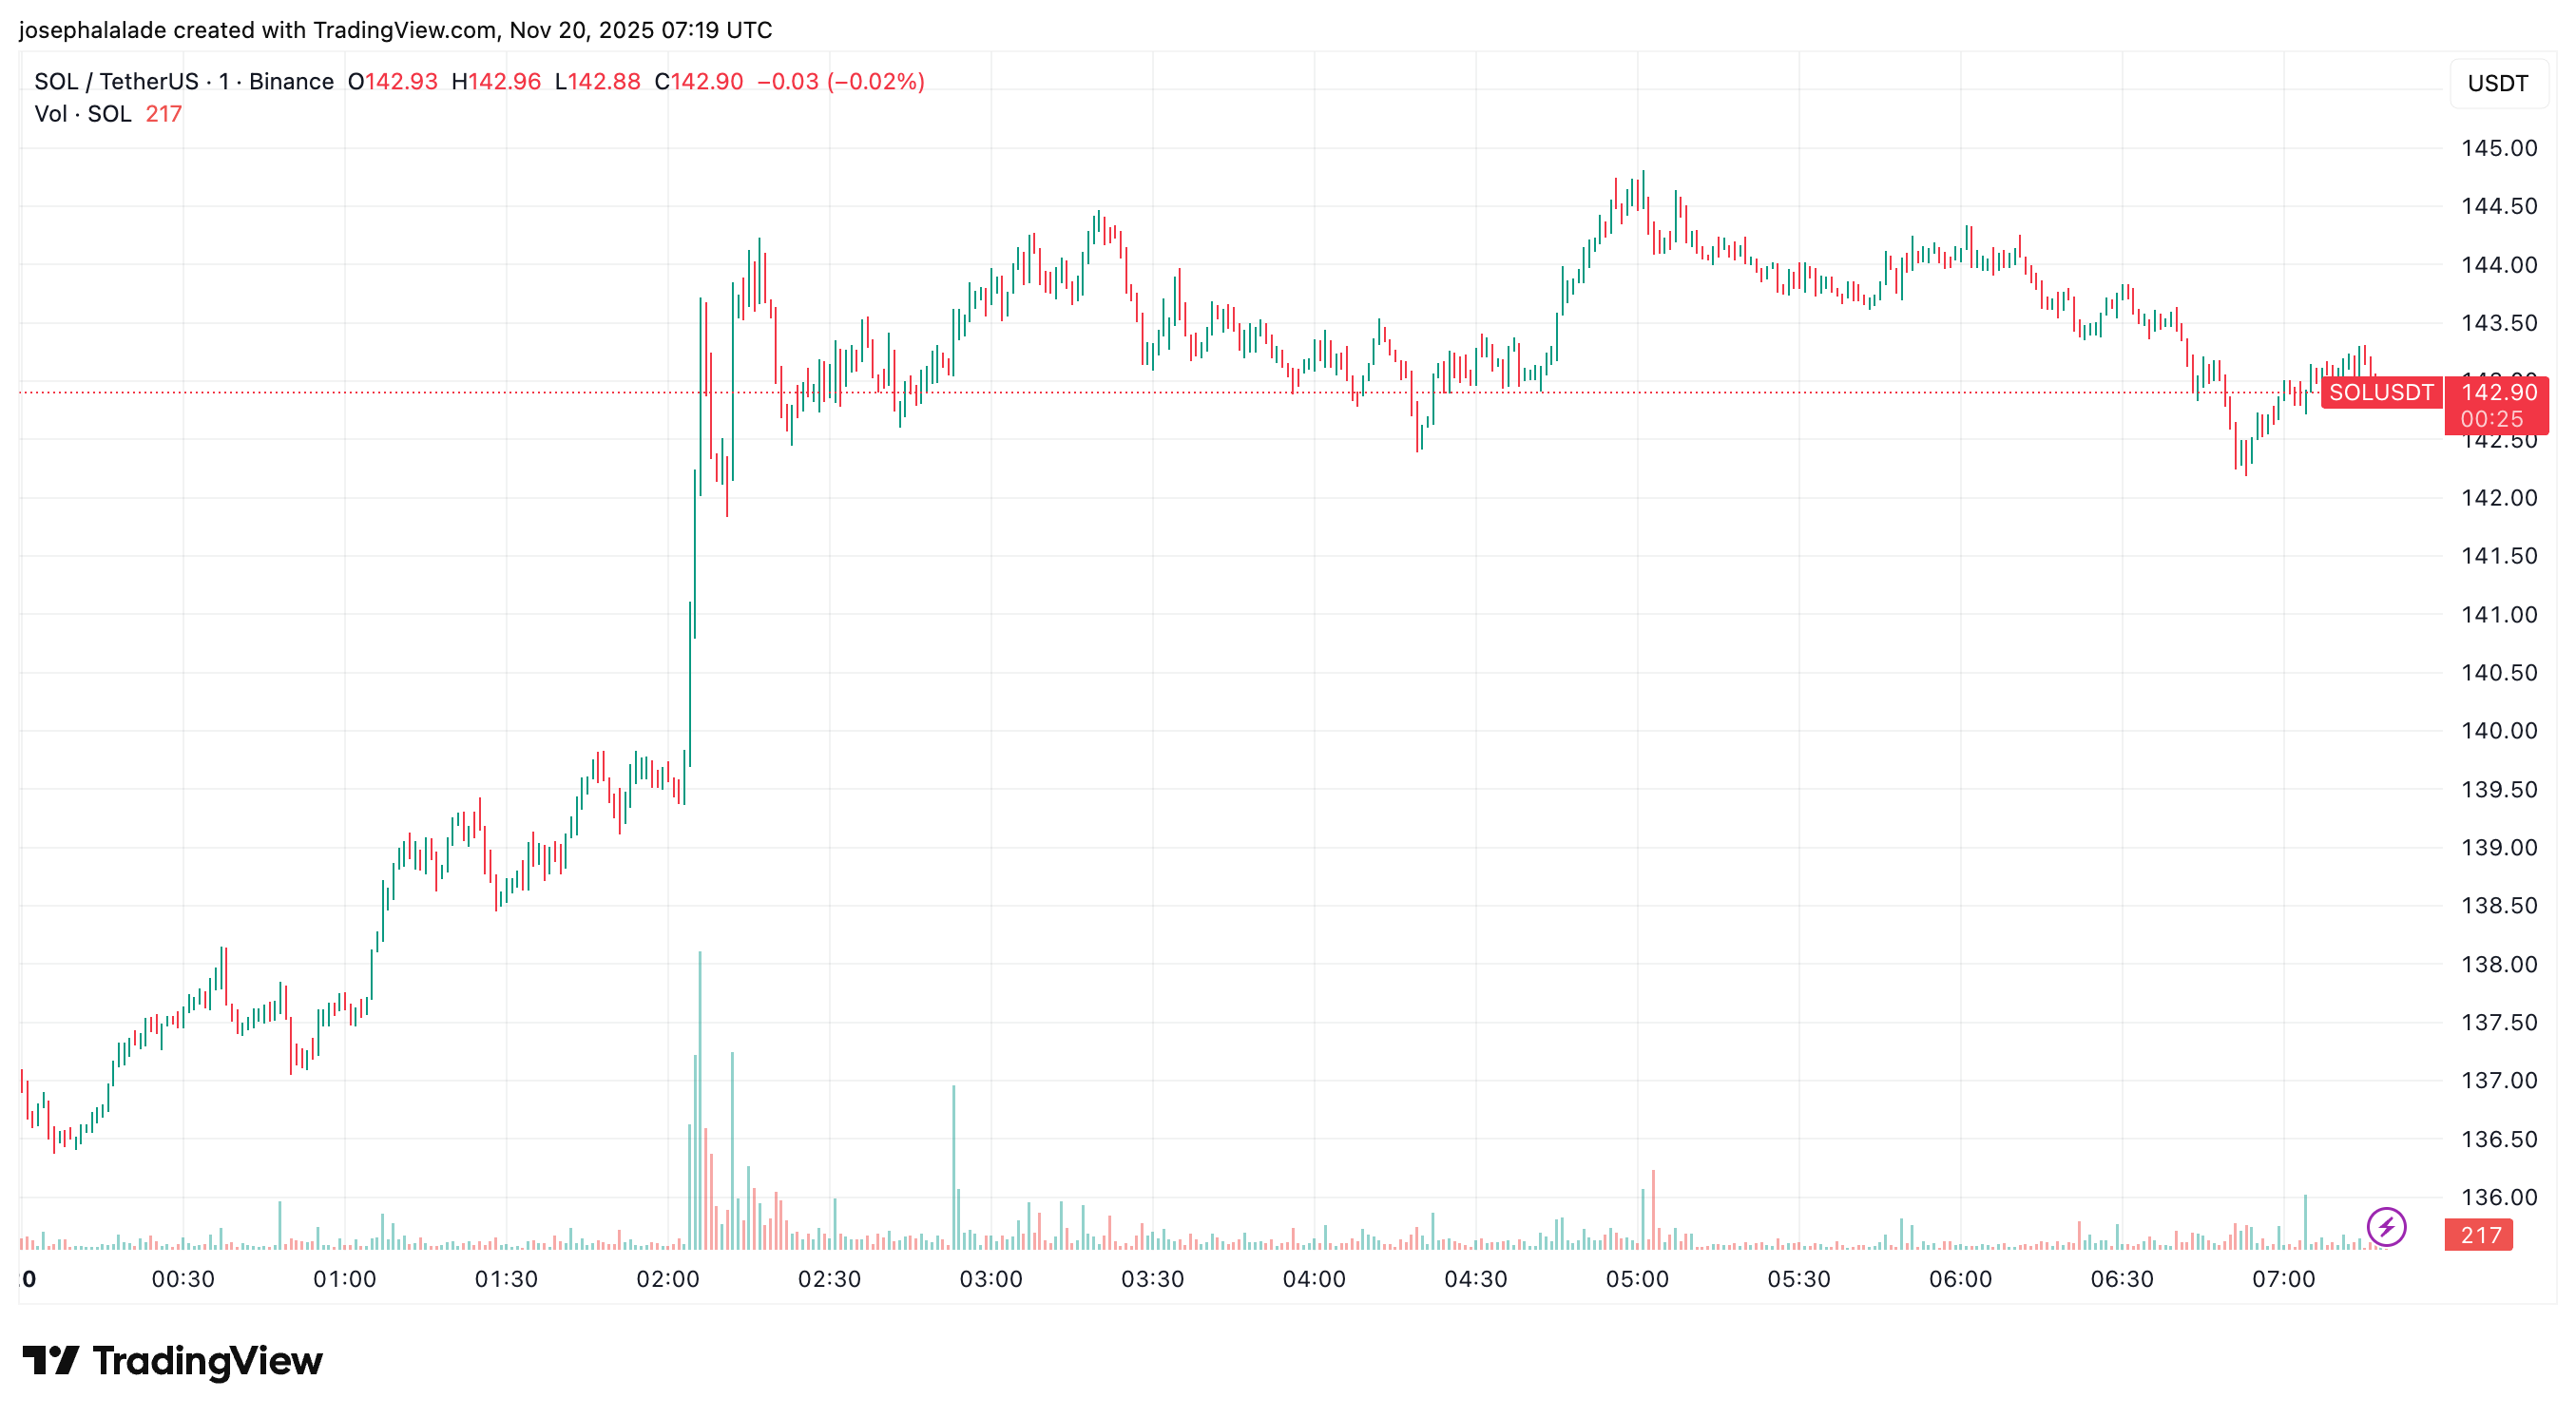
The shift began when Solana slipped under $140, briefly hitting the month’s low at $129.02 before recovering. TradingView shows SOL reclaiming the 100-hour moving average, with the hourly MACD flipping positive, a sign the market is at least attempting a short-term rebound.
ETF flows add another wrinkle. The Solana ETF complex posted $55.6 million in daily net inflows and now sits at $476.01 million in cumulative total net inflow and $714.8 million in total net assets.
According to data from Sosovalue, Bitwise’s BSOL continues to dominate with $482.7 million, even as the broader basket closed the day in the red. The flows suggest institutional buyers are still engaged, even if SOL price action looks fragile.
Still, the week has been brutal: down roughly 7% over seven days and nearly 25% over the past month. According to Solana TradingView metrics, the 1-day technical summary still leans “Sell,” with 13 sell signals vs. 3 buy signals. Moving averages remain deeply bearish on higher timeframes.
SOL RSI Flashes 2023 Signal as Traders Watch $130
Crypto Patel’s view is blunt: a “clean break below $130” sets up a direct liquidity slide into the $85–$55 range. His Solana price prediction is rooted in the weekly chart’s major resistance around $200 and the visible demand block at a much lower level.
The chart shows a wide mid-range from $72 to $22, an uncomfortable reminder of how deep the coin has corrected in past cycles based on its Solana price history.
But WebTrend counters with a very different angle: the current RSI level mirrors the 2023 bottom when SOL traded at $13. On the 3-day chart, RSI dipped into the same capitulation zone while price remains 10x higher, suggesting momentum exhaustion, not structural collapse.
Short-term traders are closely watching the 100-hour MA, which has been reclaimed. If Solana price holds above $140, the bounce could extend toward $150–$158. If not, the bearish camp gets another swing at $130, a level bulls cannot afford to lose twice.
READ MORE: Starknet Price Prediction as BTC Staking Crosses $365 Million