


- Silver price has dived by 42% from its highest level this year.
- SLV and other silver ETFs have shed assets worth billions recently.
- On the positive side, silver has formed a double-bottom pattern, pointing to a potential rebound.
Silver price has sunk into a bear market this year, moving from the year-to-date high of $121 in January to $70 today. This retreat may continue as investors continue selling their iShares Silver ETF (SLV) assets.
Silver Price at Risk as Stagflation Continues
The XAG/USD pair has crashed by over 40% from its highest point this year, mirroring the ongoing gold price crash that has moved it from a record high of $5,582 in January to $4,496 today.
This retreat has coincided with the ongoing iShares Silver ETF (SLV) outflows. Data compiled by ETF.com shows that the outflows stood at over $297 million on Friday, down from $686 million on Thursday. The fund has shed over $2.57 billion in assets this year.
Similarly, the abrdn Physical Silver Shares ETF (SIVR) has shed over $623 million in assets. It has had outflows in the past six consecutive weeks.
There are a few main reasons why the silver price is at risk of a strong bearish breakdown in the coming weeks. First, there is a risk that the Federal Reserve will maintain a hawkish tone this year as inflation continues rising.
A recent report by the OECD showed that the headline Consumer Price Index (CPI) will jump from 2.4% in February to 4.2% later this year if energy prices continue rising. Crude oil and natural gas prices may keep rising now the US-Iran war has taken a new twist, with the Houthis entering the playground.
The Federal Reserve’s main risk is that the US may be moving towards a stagflation period, which is characterized by high inflation and slow economic growth.
READ MORE: SPY and VOO Stocks Eye Bear Market as Fear and Greed Index Hits 10
There are signs that the US growth has stagnated, with the artificial intelligence (AI) industry being the only one growing. A recent report showed that the US GDP expanded by 0.7% in the fourth quarter, down sharply from 4.4% in the previous one. Another report showed that the US economy lost over 92,000 jobs in February.
Silver price is falling as concerns about the global economic growth as the war continues. Data released this week showed that the manufacturing and services PMIs from key countries like China, Europe, and the United States slowed in March as the war continues.
A slowing economy has a negative impact on silver prices because it is an industrial metal, which does well when the economic growth is doing well.
Silver Price Prediction: Technical Analysis
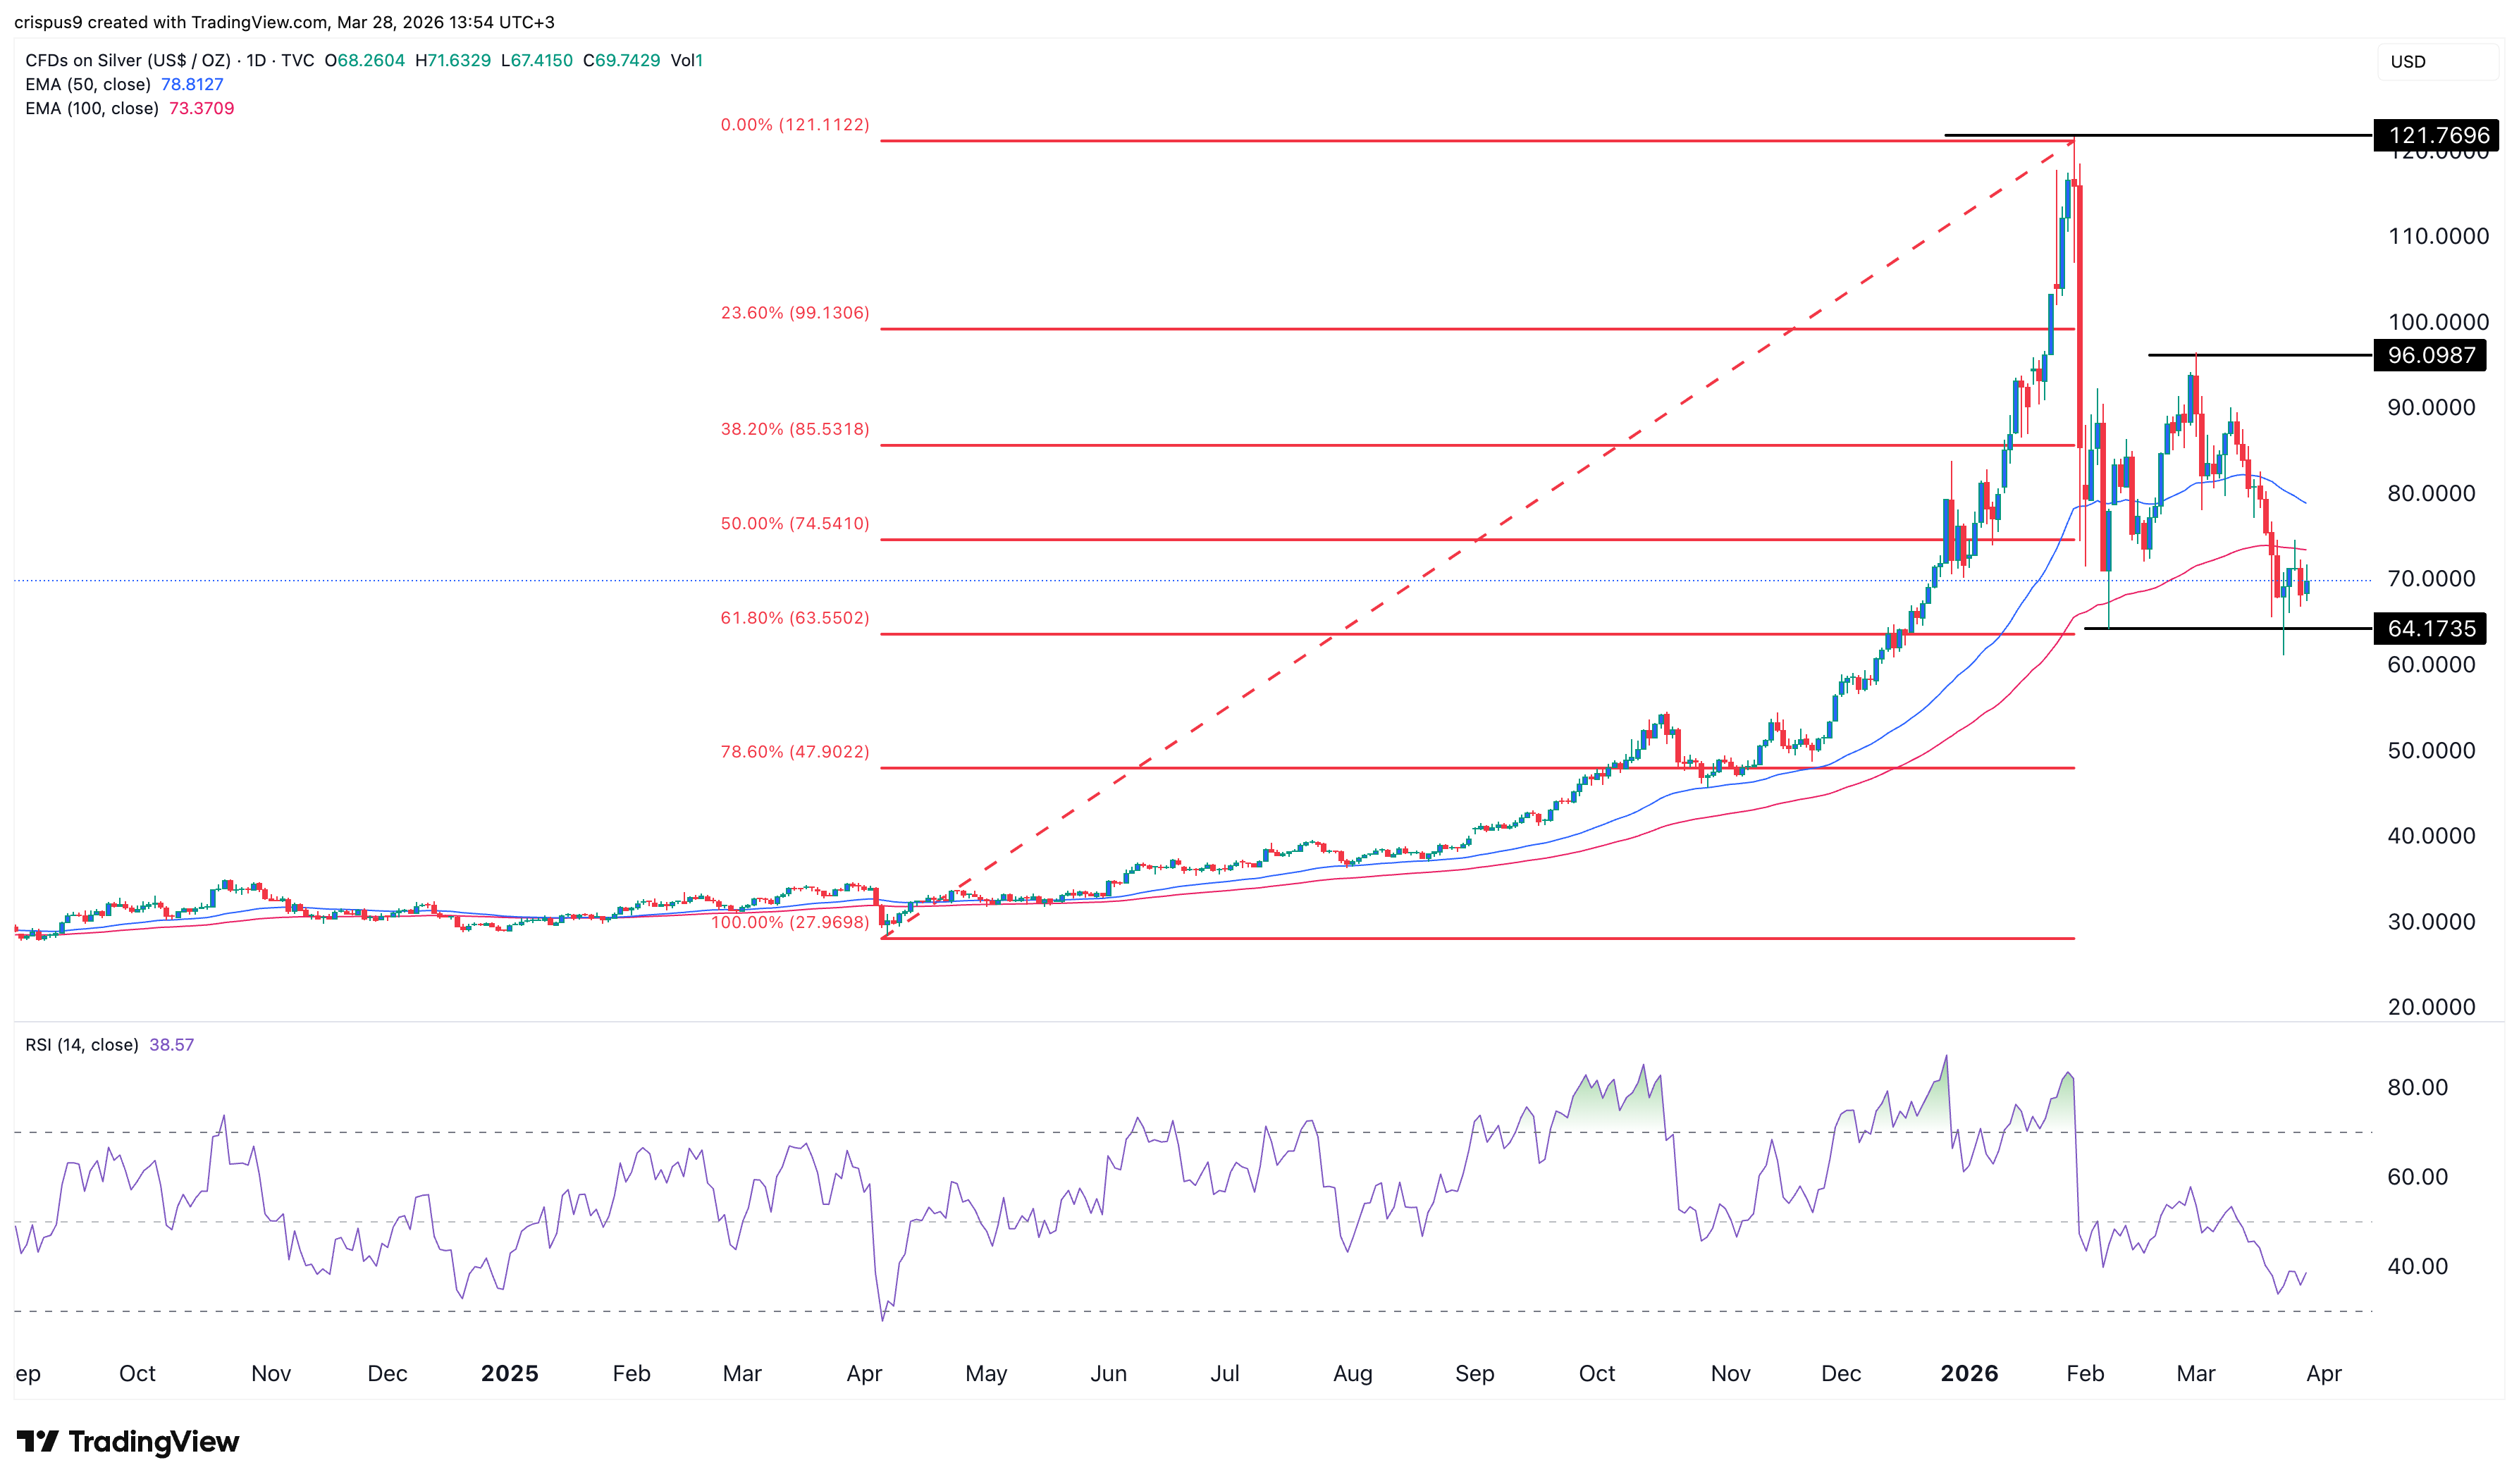
Silver price chart | Source: TradingView
The daily chart shows that the silver price has sunk in the past few months, falling from a high of $121 in February to the current $70. It has dropped below the 50-day and 100-day Exponential Moving Averages (EMA). Falling below that level is a sign that bears have prevailed.
Silver has tumbled below the 50% Fibonacci Retracement level at, while the Relative Strength Index (RSI) has dropped below the neutral point at 50. It is also forming a bearish pennant pattern, which often leads to more downside. Therefore, silver may drop sharply to the key support level at $50.
On the positive side, there are signs that the XAG price has formed a double-bottom pattern at $64 and a neckline at $96. This pattern provides a ray of hope that the silver price may rebound in the near term.
READ MORE: MARA Stock Forms an Alarming Pattern as it Sells Bitcoin Amid AI Pivot