


Bitcoin price continued to face significant pressure on Monday as the US dollar and bond yields increased, alongside a rise in spot BTC outflows. BTC was trading at $78,360 on Monday, down from the key resistance level of $82,553.
US Bond Yields Pose a Risk to Bitcoin Price
One potential risk that market participants are ignoring is the rising US bond yields. Data shows the ten-year yield has skyrocketed to 4.6%, its highest level since January 13.
Similarly, the 30-year yield has jumped to 5.122%, its highest level in years. These yields surged after the US released the latest consumer and producer inflation reports. The headline CPI jumped to 3.8%, while the PPI jumped to a multi-year high of 6.0%.
READ MORE: Dogecoin Forms a Bullish Pattern as Soaring Crude Oil Price Poses a Risk
The rising US bond yields explain why the US dollar index (DXY) has jumped to $99, its highest level in weeks. Market participants and economists simply expect the Federal Reserve to maintain interest rates steady this year, and possibly hike in 2027.
Bitcoin price tends to do well when the Fed is cutting interest rates, and vice versa. A good example of this is what happened in 2022 when the Fed hiked rates to the highest point in years. At the time, Bitcoin plunged below $16,000, while companies like FTX and Terra collapsed.
These numbers likely explain why investors have started dumping their Bitcoin holdings. Data shows that spot Bitcoin ETFs lost over $1 billion in assets last week and are about to erase the gains they made earlier this month.
The same is happening in the futures market, where Bitcoin’s futures open interest dropped to $42 billion. Also, the Coinbase Premium Index has remained in the red in the past few months, a sign that US demand has faded.
BTC Price Prediction: Technical Analysis
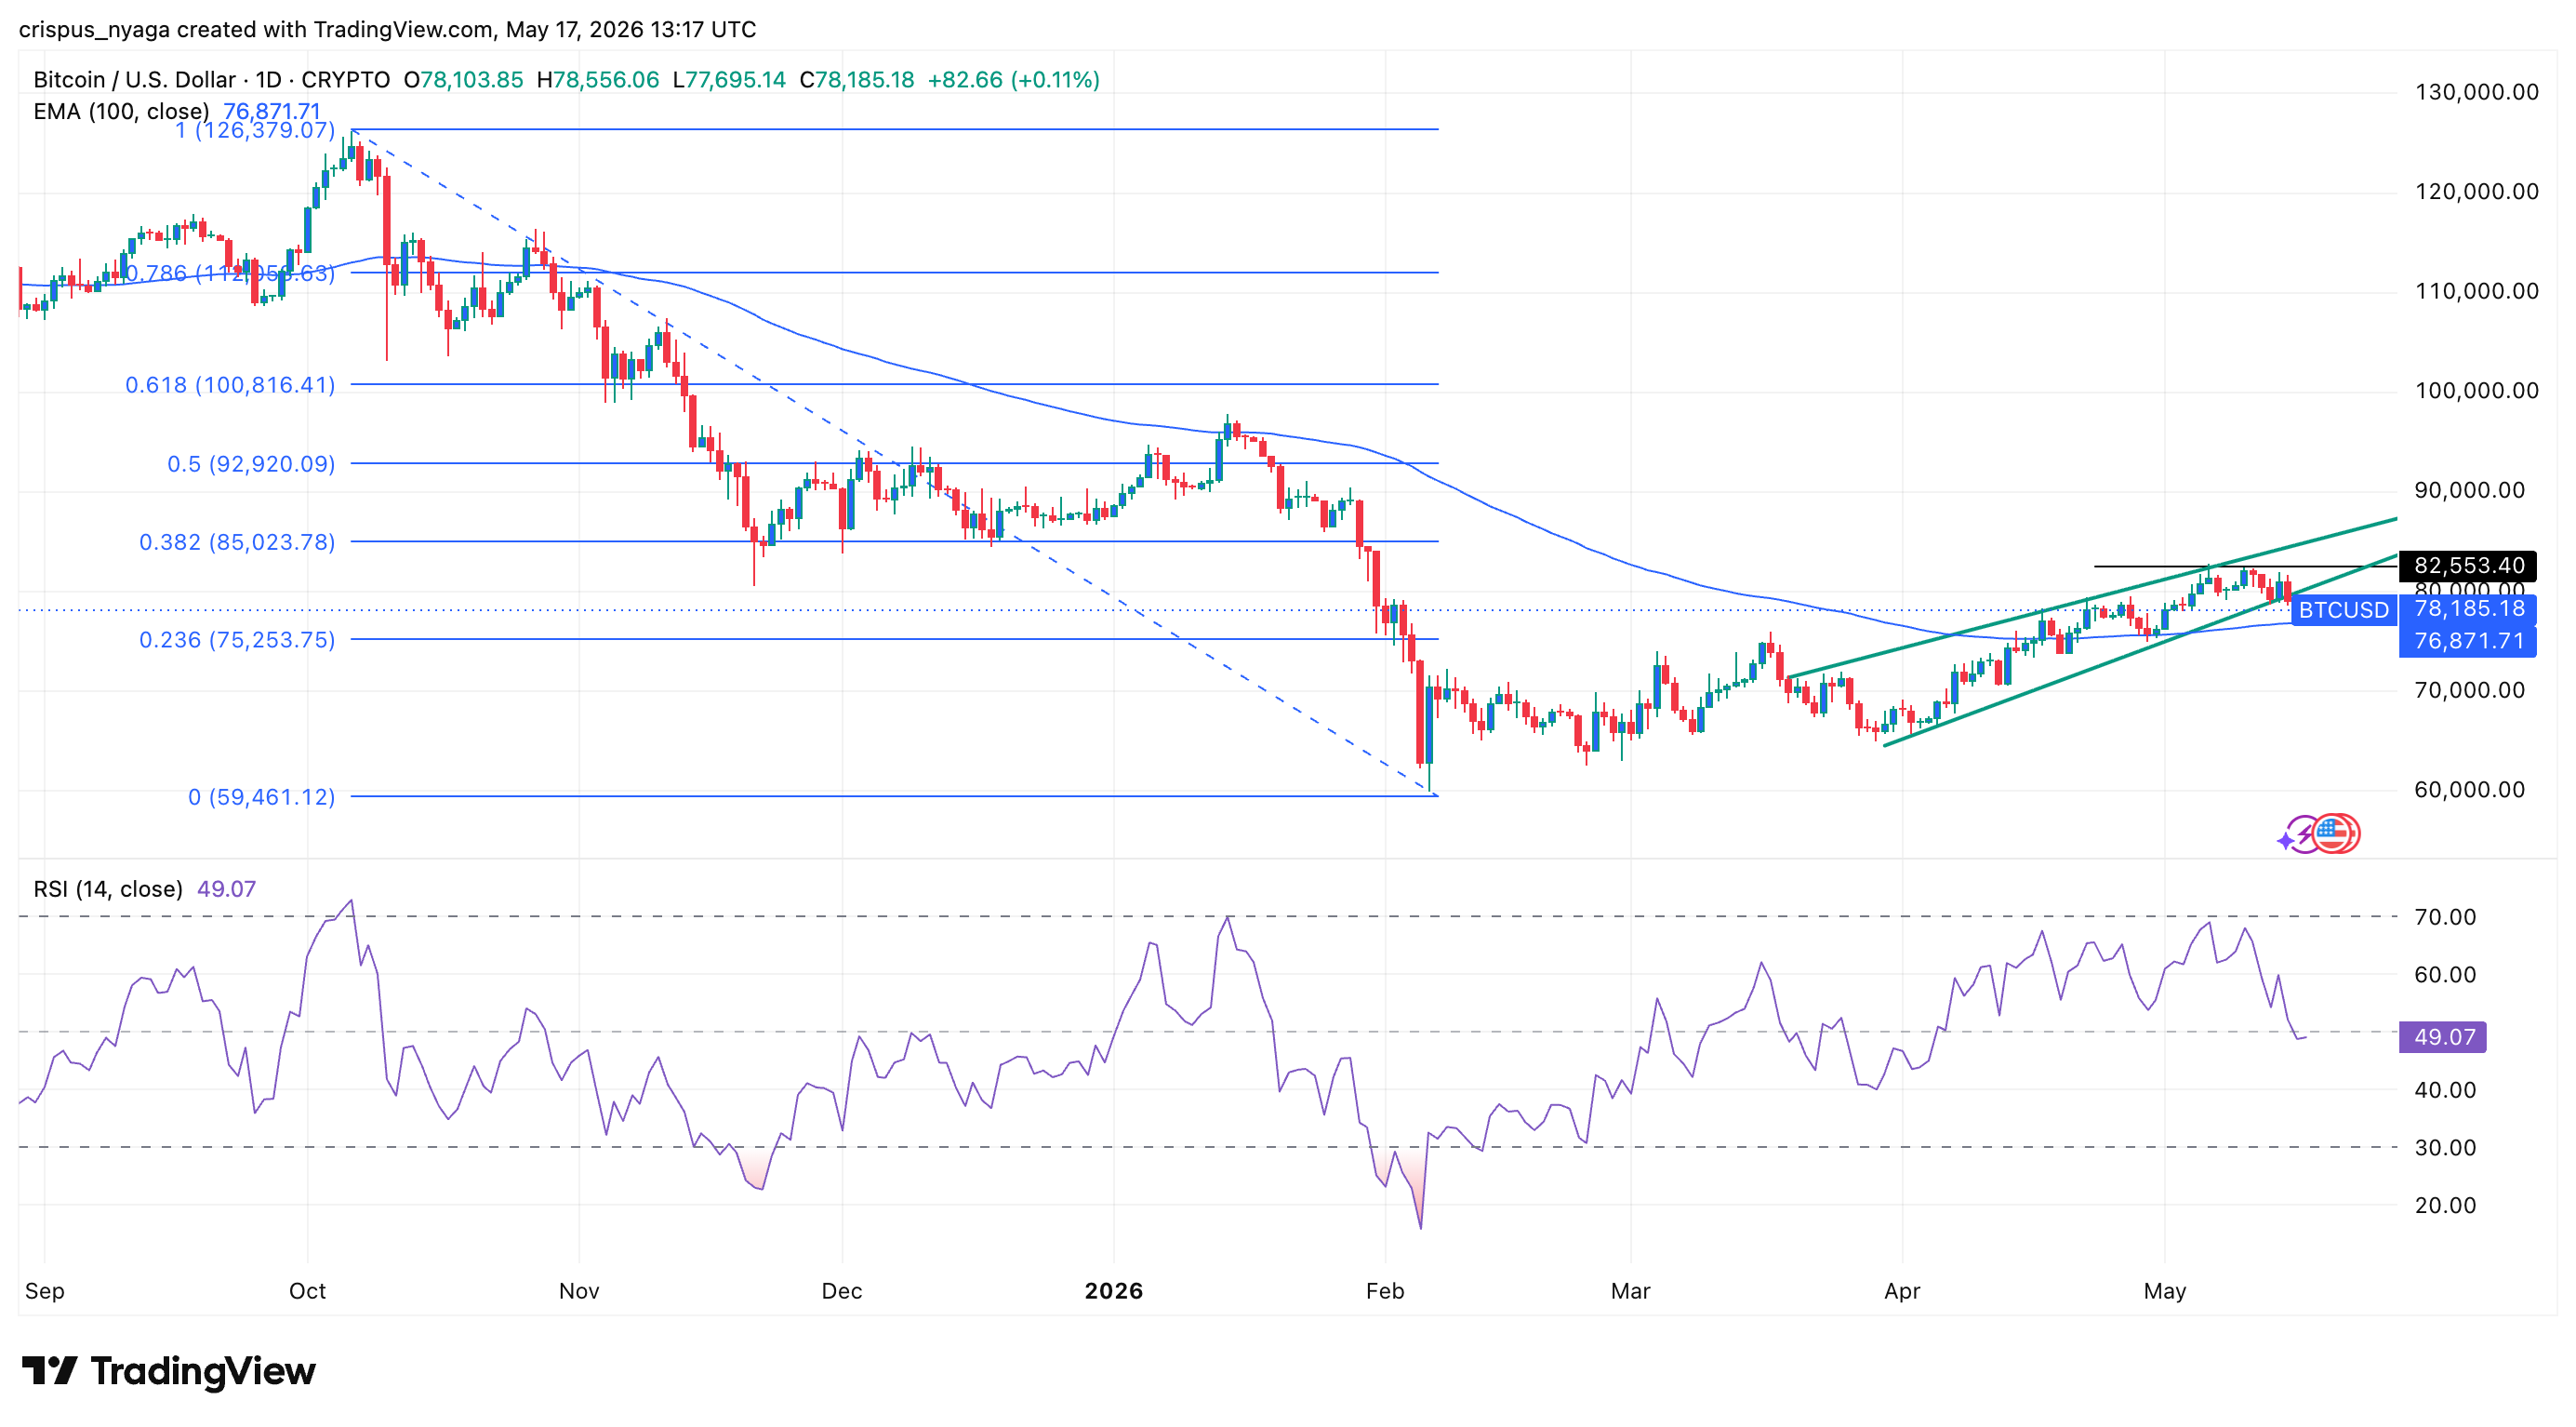
The daily chart shows that Bitcoin’s price has crashed over the past few days. This retreat followed substantial resistance at $82,553, its highest point this month.
The coin has dropped below the lower side of the rising wedge pattern. A wedge is one of the most common bearish reversal signs in technical analysis.
Bitcoin has moved below the 50-day moving average, while the Relative Strength Index (RSI) has moved below the neutral line. Therefore, the most likely scenario is that the coin continues to fall, potentially to the key support level at $70,000.
READ MORE: Top 4 AI Crypto Coins to Buy Ahead of NVIDIA Earnings on May 20