


Ethereum price continues to rise gradually as investors and analysts are uncertain about the next target levels. One view is that the ETH price will collapse to $1,000 in the coming weeks, while another opinion is that it will surge to $4,000. This article conducts a technical analysis to assess the next levels to watch.
Ethereum Price Forecast: Weekly Chart Analysis
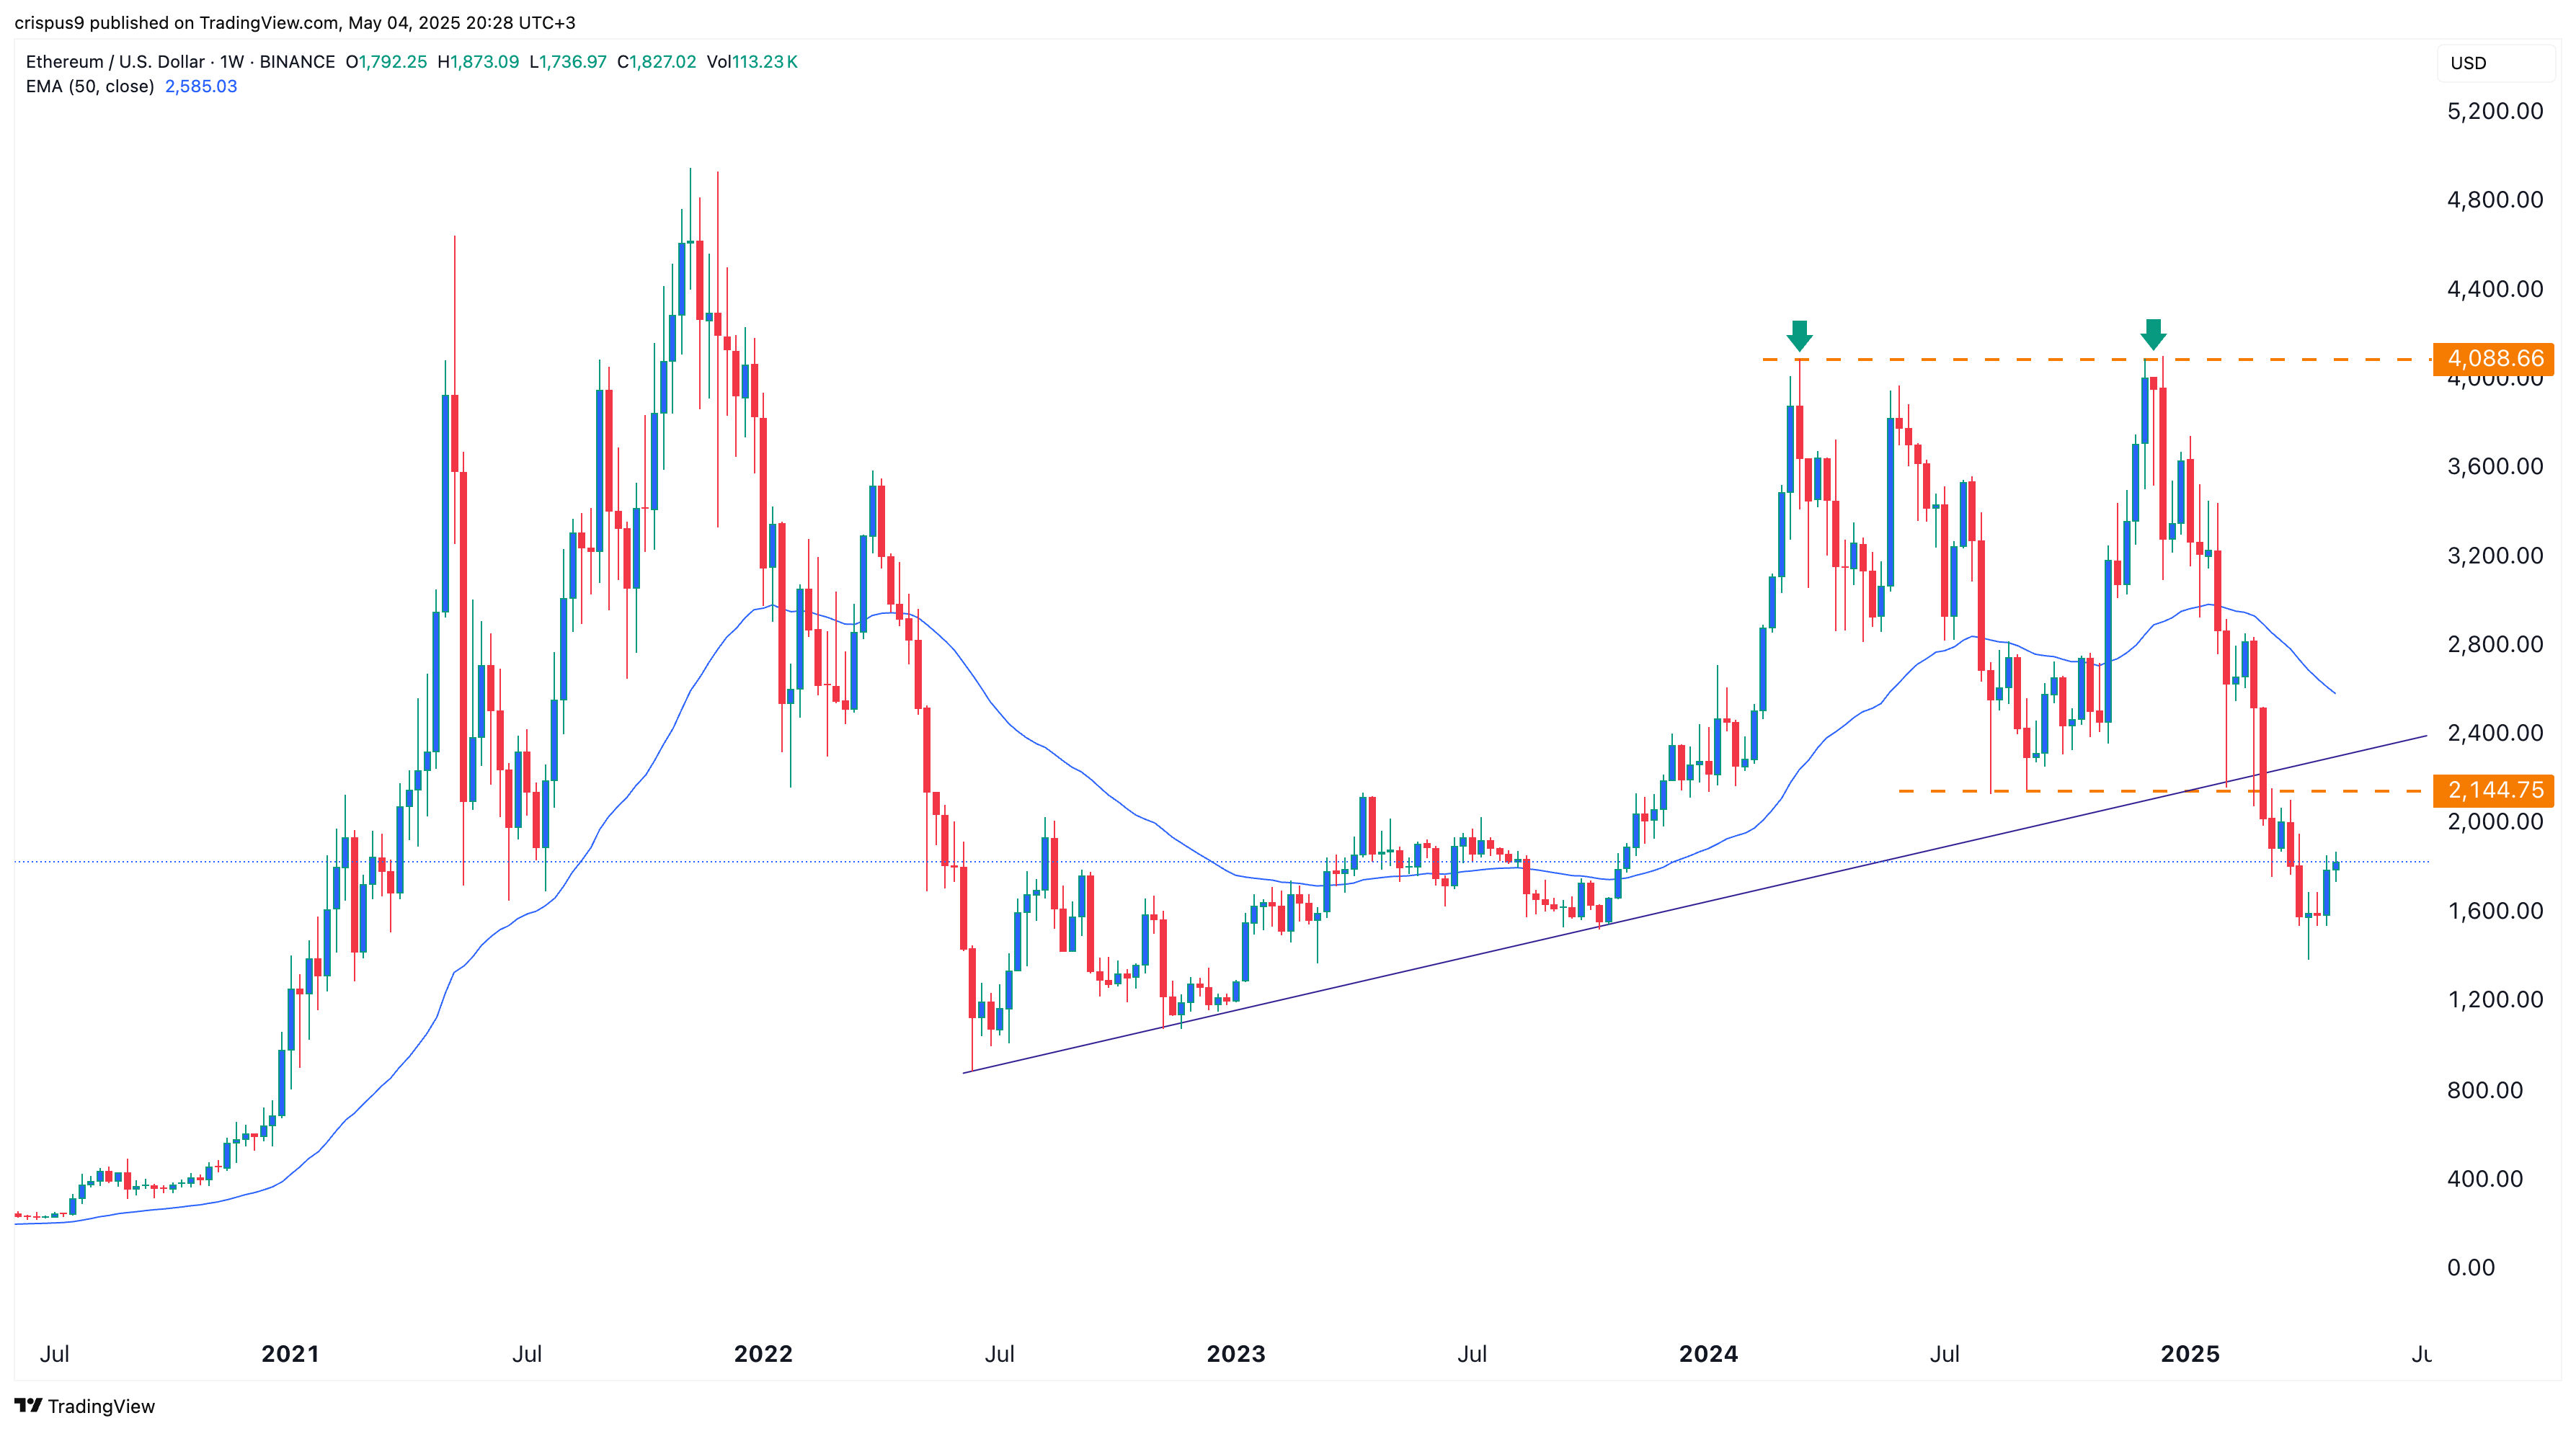
The weekly chart provides a clearer picture of what to expect in the coming weeks. It shows that the price formed a double-top pattern at $4,088, with its neckline at $2,145, its lowest level in August of the previous year. A double-top is one of the most bearish patterns in technical analysis.
Ethereum price has dropped below the neckline at $2,145. It also moved below the ascending trendline connecting the lowest swings since June 2022. Worse, the coin has crashed below the 50-week and 100-week moving averages, signaling that bears are in control for now.
READ MORE: Sonic Price Analysis: Why Andre Cronje’s Crypto is About to Soar
Additionally, the most likely scenario for the ETH price is that it will bounce back and retest the critical resistance level at $2,145. A break-and-retest pattern is a popular continuation sign in the market.
Therefore, if this forecast works well, there is a risk that the coin will drop to the key support at $1,000. This target is derived by measuring the distance between the double-top and the neckline, and then projecting the same distance from the neckline.
The bearish Ethereum price forecast will be invalidated if the coin rises above the neckline at $2,145. If this happens, the next level to watch will be $2,500, followed by $3,000.
ETH Price Analysis: Monthly Chart Analysis
The monthly or all-time chart can clearly show what is happening with an asset. The coin has dropped for five straight months, bringing the Relative Strength Index (RSI) to 42, its lowest level since June 2022. It has never fallen below this level since its inception.
The RSI at 42 indicates that the coin has not become oversold yet, signaling that it has more downside to go. ETH has also just crossed the 50-month moving average for the first time since 2022.
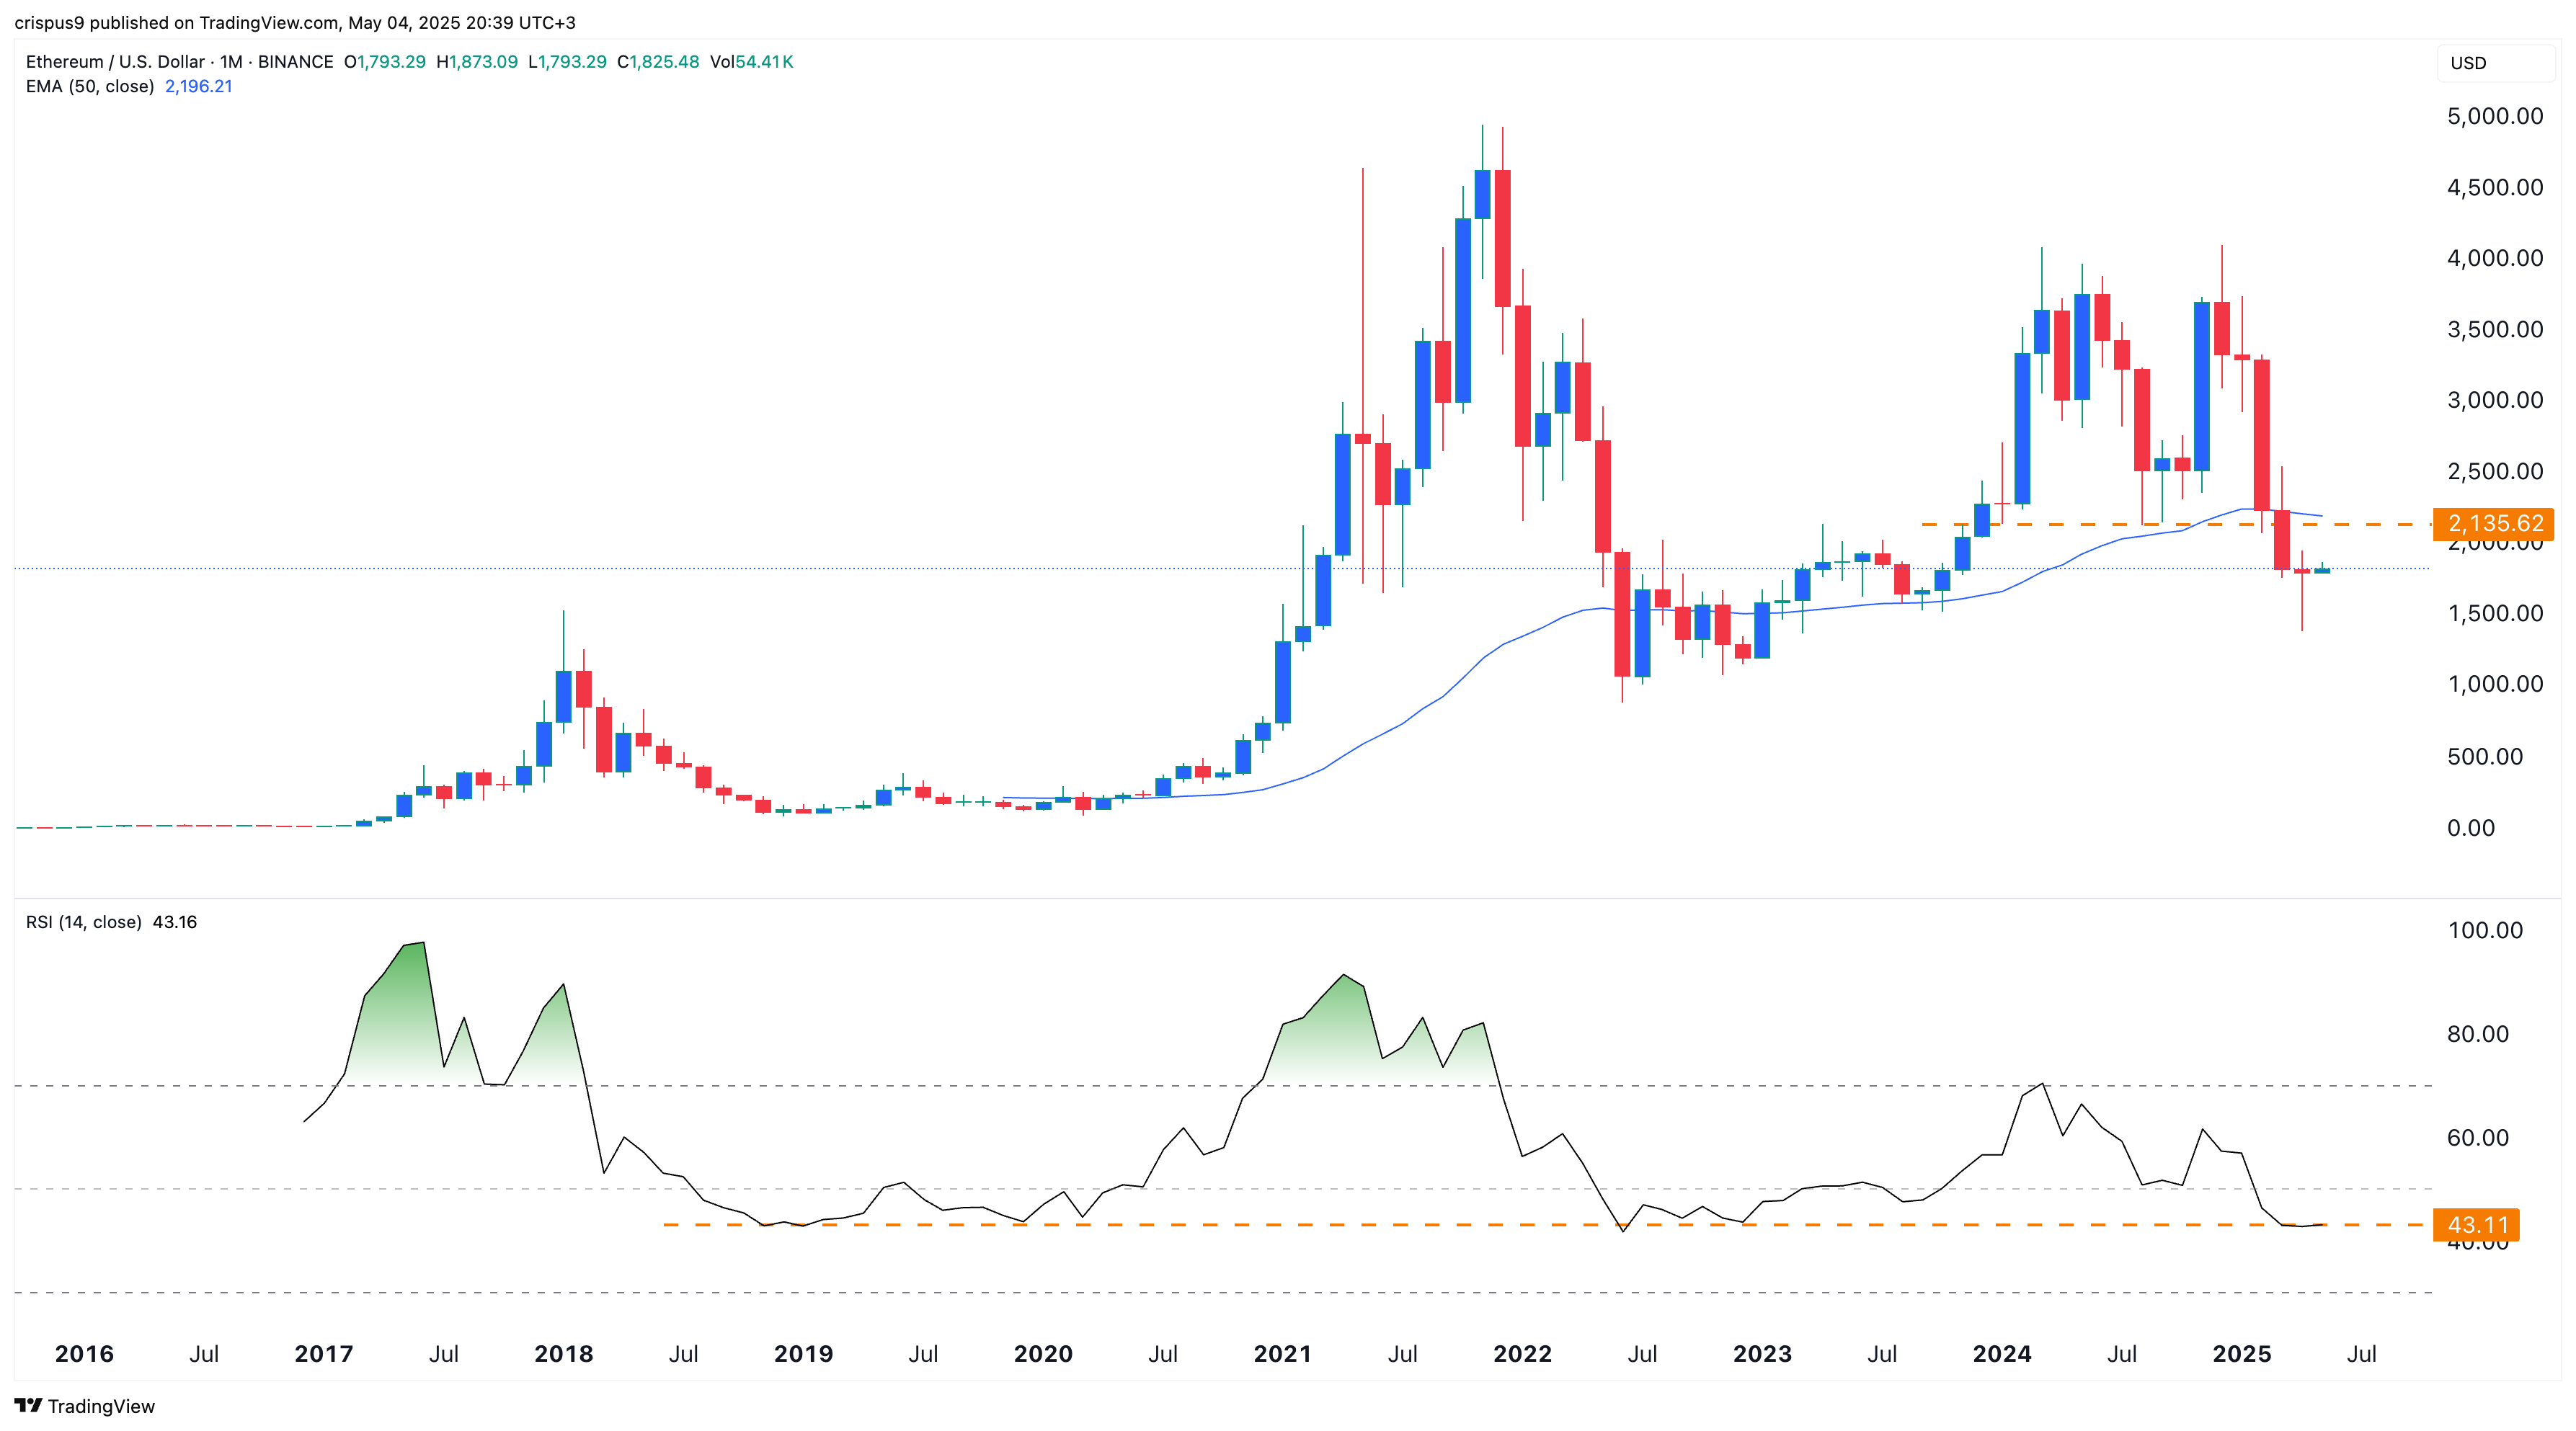
On the positive side, a long-legged doji candlestick pattern emerged last month. This pattern is characterized by a small body and a long shadow, and it often leads to a rebound. In this case, the rebound could be to the neckline at $2,135.
Therefore, the weekly and monthly charts suggest that the Ethereum price may first fall to $1,000 before rising towards $4,000.
READ MORE: Ethena Price at Risk Ahead of a $50M Token Unlock