


- Litecoin price has been in a strong bullish trend recently.
- It has formed a rising wedge pattern that is usually highly bearish.
Litecoin price has come under intense pressure and formed a rising wedge pattern. LTC dropped to a low of $60.60, which was the lowest level since August 10th. The price is about 72% below the highest level this year, bringing the total market cap to over $4.3 billion.
Is the LTC recovery ending?
Litecoin is a leading cryptocurrency that was developed to become a better alternative to bitcoin. It solves some of the top challenges that bitcoin such as its slow speed and high transaction costs. Unlike BTC which has a total supply cap of 21 million, LTC has a supply cap of 84 million.
Similarly, the average transaction cost of about $0.0070, which is lower than bitcoin’s cost of over $1. Therefore, many people prefer using LTC instead of BTC for transactions. At the same time, many litecoin holders do so for its investment purposes.
Litecoin price has staged a strong recovery in the past few weeks as cryptocurrencies recover. It rose from a low of $40 to a high of $60.84. This recovery happened as investors remained optimistic about the financial market.
Learn more about how to buy Litecoin.
For example, stock indices like the Dow Jones and the tech-heavy Nasdaq 100 indices have rallied by more than 20% from their lowest levels this year. Similarly, the closely-watched VIX index has dropped to the lowest point since April. VIX is an important measure of volatility in the market.
Additionally, the fear and greed index has moved from the extreme fear level to the greed point of 60. The US dollar has also pulled back from its year-to-date high of $109.30 to about $106.
Litecoin also rallied because of the strong performance of Ethereum as investors wait for the upcoming merge event.
Litecoin price forecast
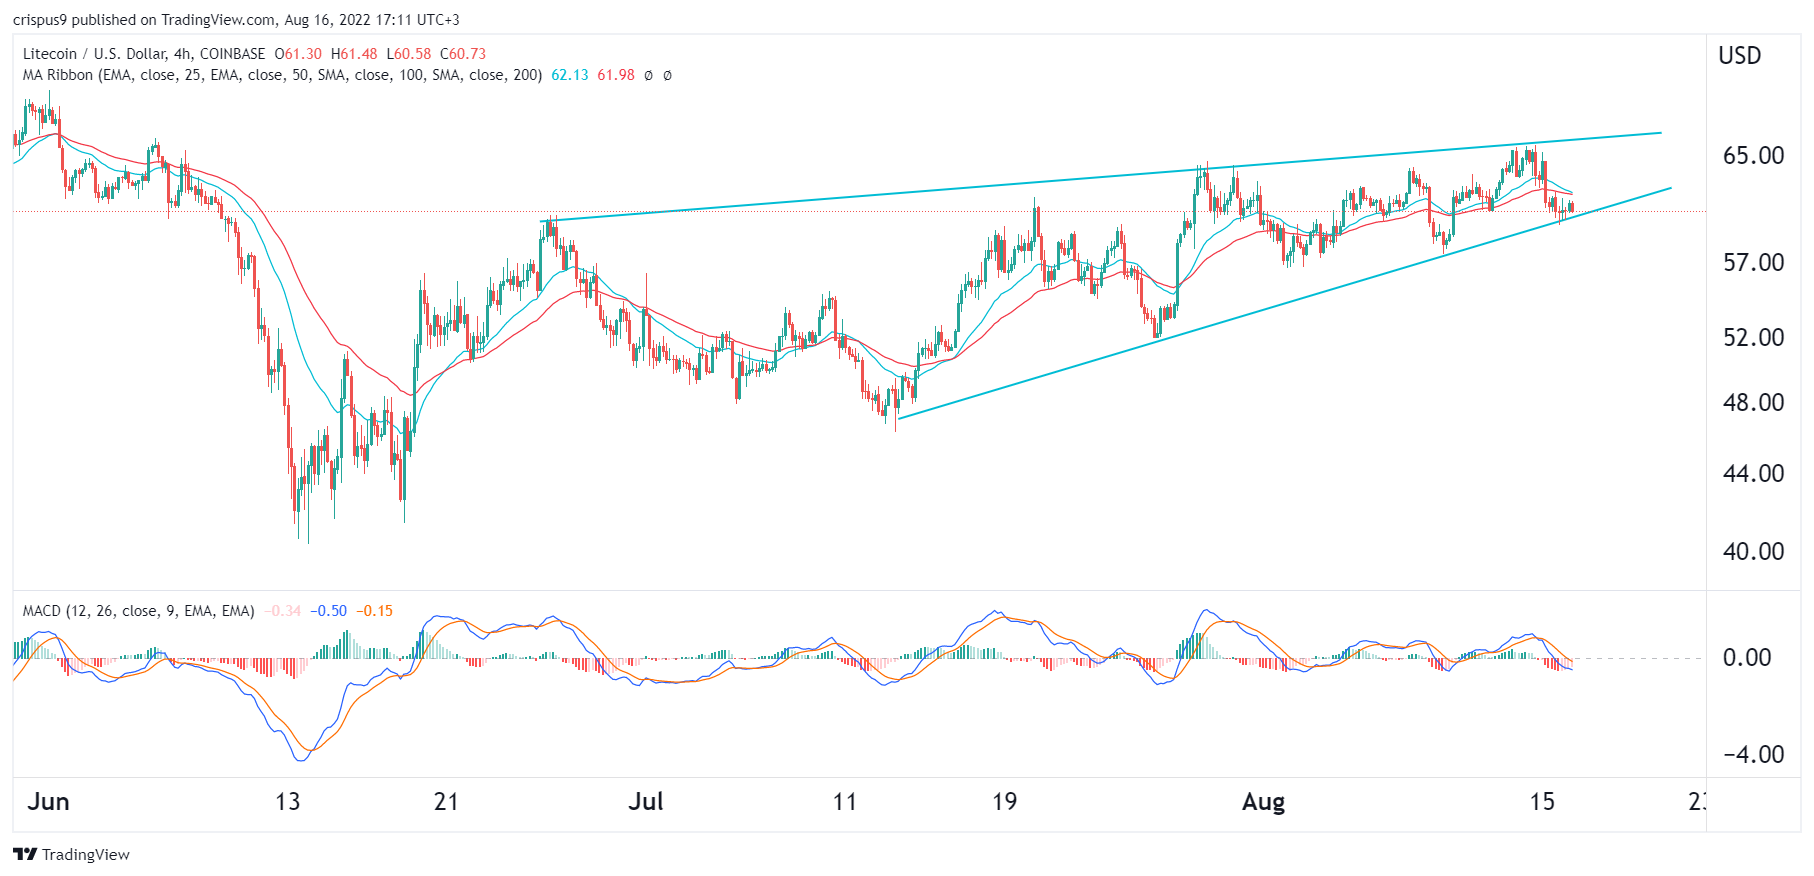
The four-hour chart shows that the LTC price has been in a strong bullish trend in the past few months. In this period, the coin has jumped by more than 72% from the year-to-date low. However, a closer look shows that the coin has been forming a rising wedge pattern that is shown in green.
In price action analysis, this pattern is usually a bearish pattern. Therefore, with the pattern nearing its confluence level, there is a likelihood that it will soon have a bearish breakout. If this happens, the next reference level to watch will be at $50.