

- Litecoin has been in a strong bull run since June 2022.
- A look at on-chain metrics shows that the number of transactions has been steady.
- Litecoin's hash rate has jumped to an all-time high.
Litecoin price has done extremely well since July last year, making it a better performer than most large-cap coins like Bitcoin, XRP, and Ethereum. Unlike Bitcoin, which started its comeback in 2023, LTC started its rally in June. Its lowest point after the FTX collapse was about 17% above its lowest level in 2022.
Why did LTC soar?
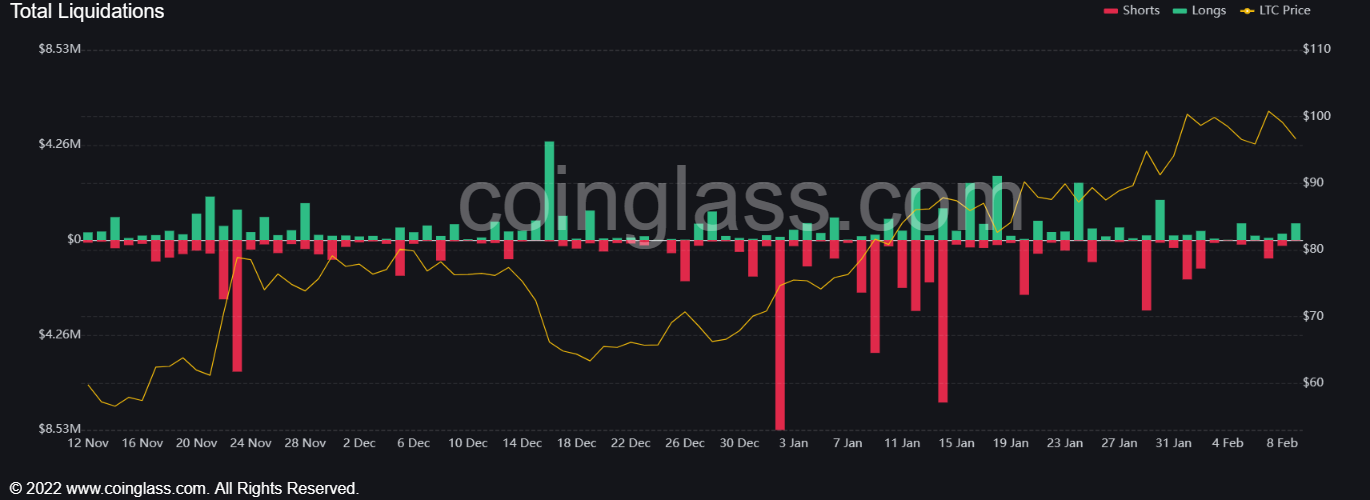
It is unclear why Litecoin price has jumped and outperformed most coins. However, a closer look at on-chain data sheds more color on what is going on. First, let us look at shorts liquidation data, which is provided by CoinGlass.
The chart, which starts in November, shows that liquidations soared during the month even as fear about FTX rose. Shorts covering then regained momentum in January. In most periods, this short covering is usually seen as a bullish catalyst for an asset. I wrote about Ethereum in January.
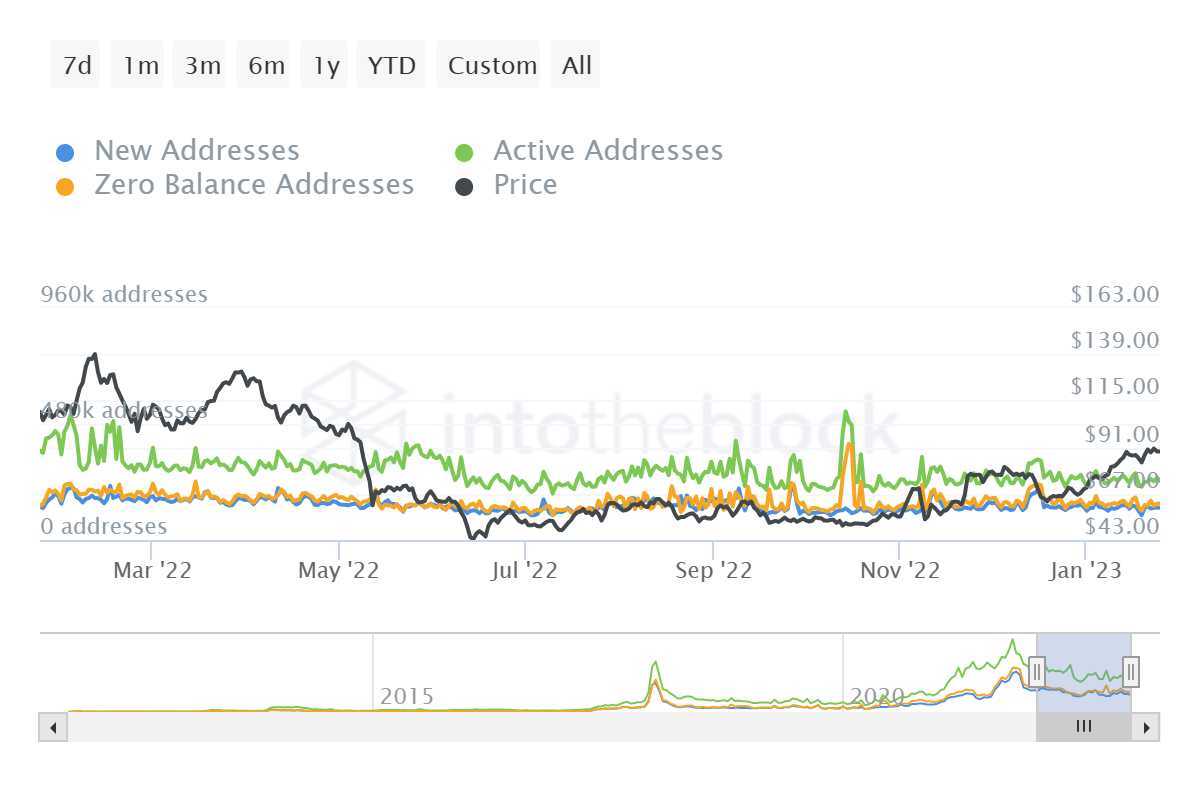
The other reason is why Litecoin price has done well is that the number of holders known as sharks has been growing since July last year. While whales are usually important in crypto, sharks, who own between 100 and 10,000 coins are equally important.
They have added millions of coins in their holdings, which is usually a bullish factor. Most importantly, as shown below, the number of daily active addresses has been a bit stable since July.
Find out how to buy Litecoin.
Further, it seems like more people are using Litecoin vs Bitcoin because of its reasonable fees. The average transaction fee in Litecoin stands at 0.00013 LTC or $0.001. In contrast, average transaction fee for Bitcoin is reasonably high. And since the two coins work in a similar way, many people seem to be preferring Litecoin.
The evidence of this is in the number of transactions in the network. As you can see below, Litecoin handled about 88k transactions on June 14 when the bull rally started. On January 20, it was handling over 102k transactions.
Litecoin price prediction
There are more charts we can use to explain the remarkable comeback of LTC prices. For example, unlike Monero, Litecoin’s hash rate sits at its all-time high. This is a signal that its network is getting safe by the day.
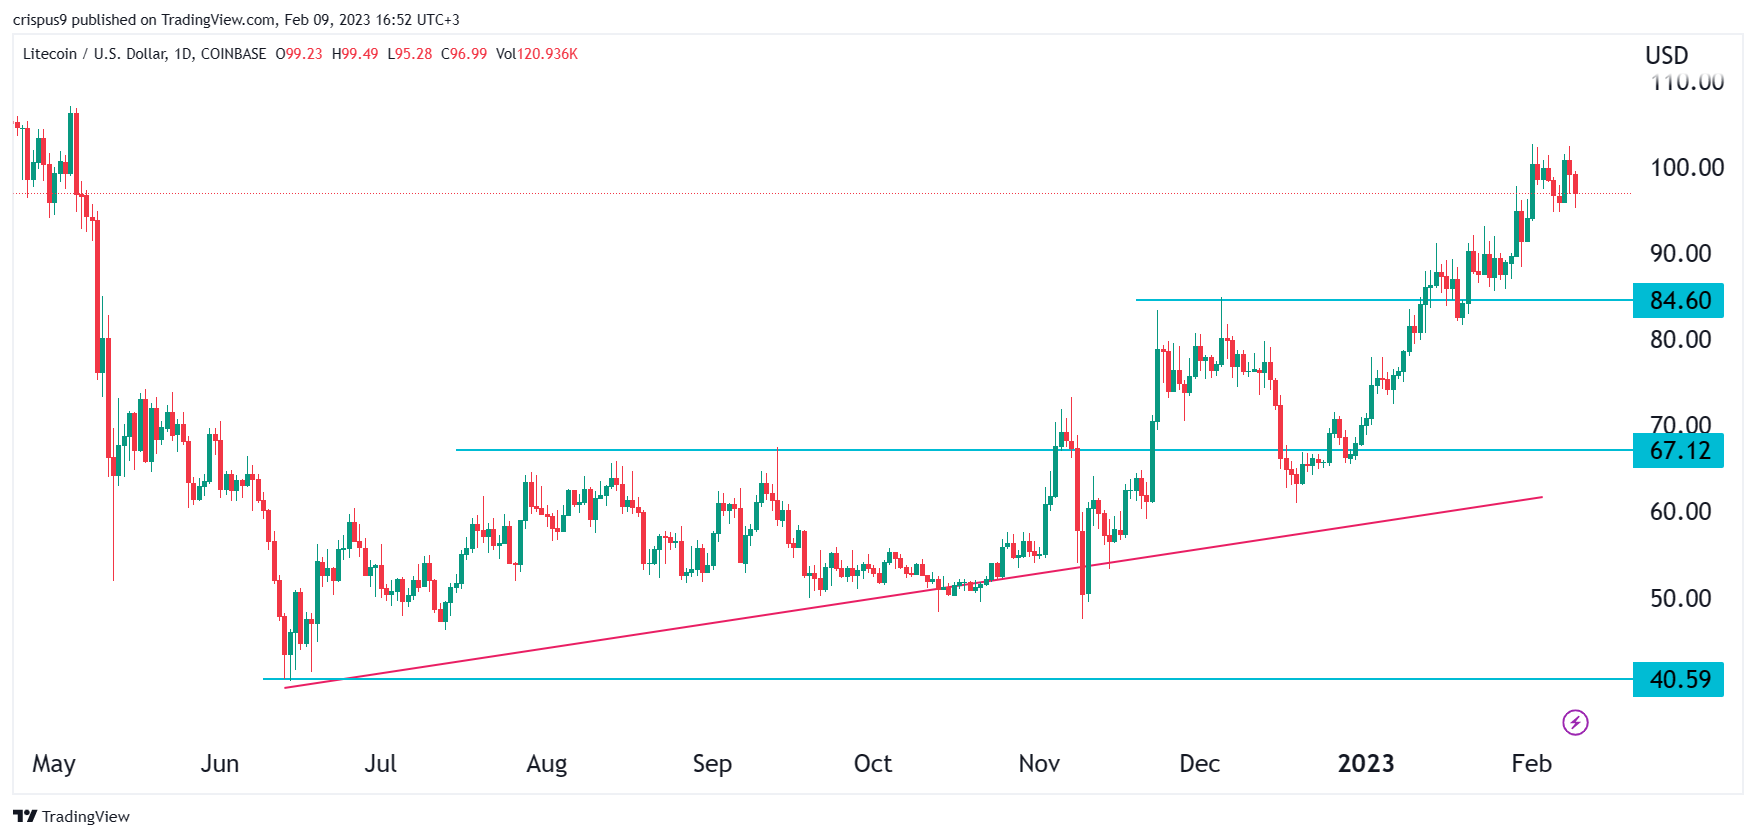
Now, turning to the daily chart, we see that the Litecoin price has crossed key resistance levels like $80 and $90 recently. It is being supported by all moving averages. Indeed, a golden cross has happened, as the 200-day and 50-day moving averages have made a bullish crossover pattern.
Therefore, while it has formed a small double-top pattern, there is a likelihood that the bullish momentum will continue as buyers target $110.