


- Inflation and tightening liquidity have placed extreme pressure on the over-leveraged crypto ecosystem
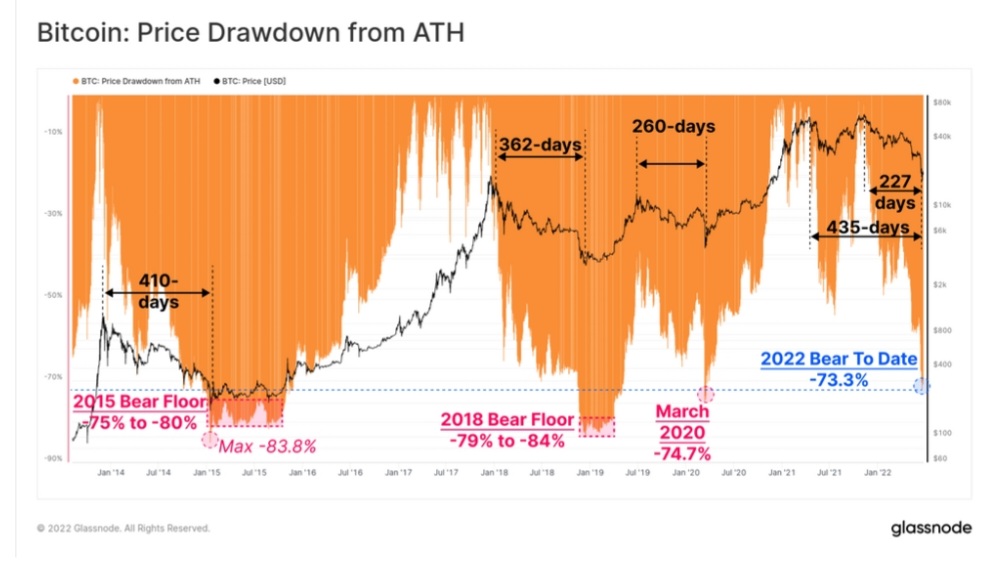
- Bitcoin drawdown has reached 73.3% below the Nov-2021 ATH
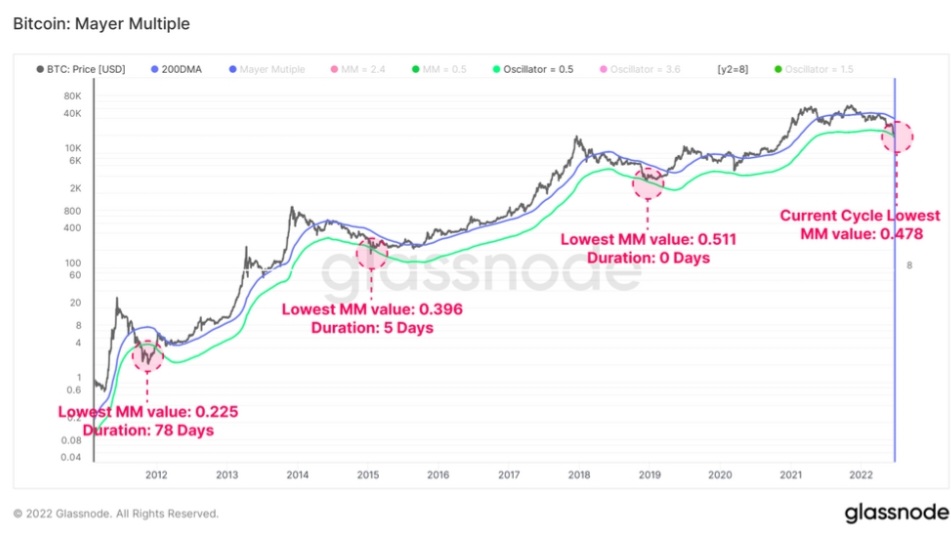
- Prices of Bitcoin have fallen below half its 200 DMA
With inflation and tightening liquidity placing extreme pressure on the over-leveraged crypto ecosystem and Bitcoin (BTC) and Ethereum (ETH) both having traded below their previous cycle all-time highs (ATHs), markets have plunged a “great proportion” into unrealized loss with all 2021-22 investors now underwater, according to a report.
A report compiled by blockchain analytics firm Glassnode states that as this financial pain sets in, a large number of investors are liquidating their holdings, locking in record realized losses.
BTC drawdown at 73% below its Nov ATH
Bear market lows have historically been established with BTC drawdowns of 75% to 84% from the ATH and taking a duration of 260-days in 2019-20, to 410-days in 2015.
“With the current drawdown reaching 73.3% below the Nov-2021 ATH, and taking a duration between 227-days and 435-days, this bear market is now firmly within historical norms and magnitude,” it states.
BTC falls below half its 200 DMA
Glassnode demonstrated how BTC moving below its 200 Day Moving Average (DMA) corresponds to a bear market and more so when its prices trade below its 200-week Moving Average.
In the current bear market, the prices of Bitcoin have fallen below half its 200 DMA.
If 200 DMA is considered as a long-term mean, the Mayer Multiple (MM) records price deviations above and below, to denote overbought or oversold conditions, respectively.
For the first time in history, the 2021-22 cycle has recorded a lower MM value (0.487) than the previous cycle’s low (0.511). Only 84 out of 4160 trading days (2%) have recorded a closing MM value below 0.5.
Changes to BTC’s fundamental value
On-chain analysis can help assess changes to BTC’s fundamental valuation models based on actual coin holding and spending patterns.
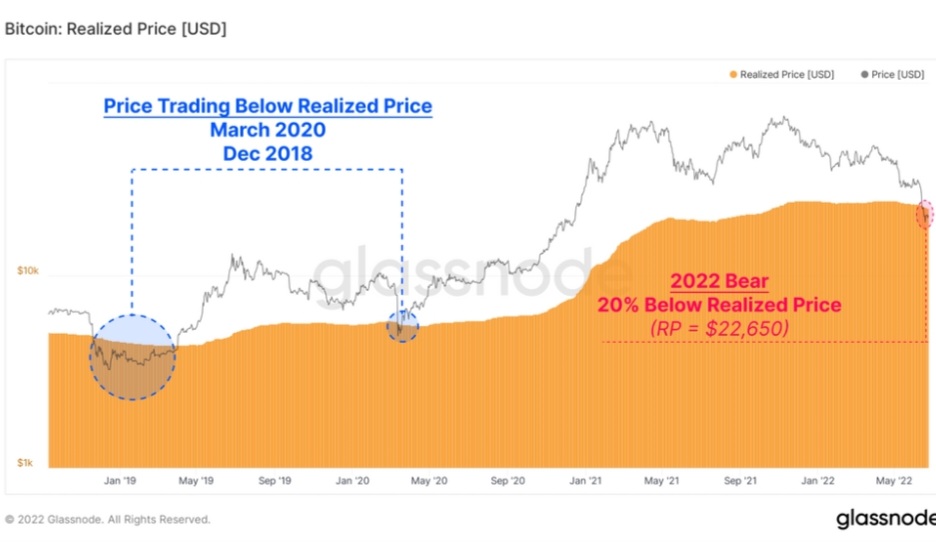
Extreme capital outflow and realized losses can be assessed by changes to the aggregate cost basis per coin, via the Realized price.
“Moments, where spot prices trade under the realized price, are uncommon, with the current market being only the third time in the last six years. The last two events were the March 2020 COVID Crisis, and the Nov 2018 capitulation event, both of which put the bottom in for that bear market cycle,” Glassnode states.
Spot prices are currently trading at an 11.3% discount to the realized price, signifying that the average market participant is now underwater on their position.
2022 is a tough year for digital assets
Many on-chain and market performance metrics have reached historically, and statistically significant lows.
“The various studies described above highlight the sheer magnitude of investor losses, the scale of capital destruction, and the observable capitulation events occurring over the last few months. Given the extensive duration and size of the prevailing bear market, 2022 can be reasonably argued to be the most significant bear market in the history of digital assets,” Glassnode states.